


Digital factory
J8/ Model — OEE Software - Excel - Overall Equipment Effectiveness - Automotive Industry
Couldn't load pickup availability
The OEE Calculation Software changes how industries monitor and enhance their performance. It tracks and analyzes vital data like downtime, production rates, and scrap rates. This gives real-time insight into production performance and enables quick decision-making to fix issues and boost productivity. OEE is a crucial tool for Industry 4.0.
To know more about OEE, check out “ All you need to know about OEE (Overall Equipment Effectiveness) ”
Steps to Monitor and Improve Your OEE (Overall Equipment Effectiveness)
Step 1: Install a Data Collection Device
Step 2: Connect Your Data to Excel
Step 3: Update Reports
Step 4: Implement an Action Plan (PDCA)
Structure and Key Components
1. A OEE monitoring table
-
Dashboard with dynamic filters that integrate essential KPIs for monitoring OEE, performance, quality, and availability. To learn more about calculating OEE, check out an example on ( A Complete Guide to Calculate and Improve your OEE)
2. A Pareto Availability loss analysis dashboard
- Analysis of the main causes of availability loss using dynamic filtering by team, machine, and timeline
3. A Pareto dashboard for analyzing scrap rates
- Analysis of the main causes of scrap using dynamic filtering by team, machine, and timeline
4. Availability Rate Monitoring by Machine
- Tracking of the Top 8 Machines with the Most Downtime in a Recent Period
5. Quality Rate Monitoring by Machine
- Tracking of the 8 critical Machines Generating scraps in a Recent Period
6. Data Entry Sheets
- Category: Category entry sheet (teams, stations, causes)
- Batch: Batch entry sheet to record daily production campaigns: Date, team, required production time, good parts to produce objectives, good parts produced
- Scraps: Entry sheet per team and per day of the quantities of good, reworked and rejected parts with the causes
- Stoppages: Team entry sheet for production stoppages and the causes and types of stoppage (scheduled stoppage, breakdown, organized malfunction, series change, non-quality)
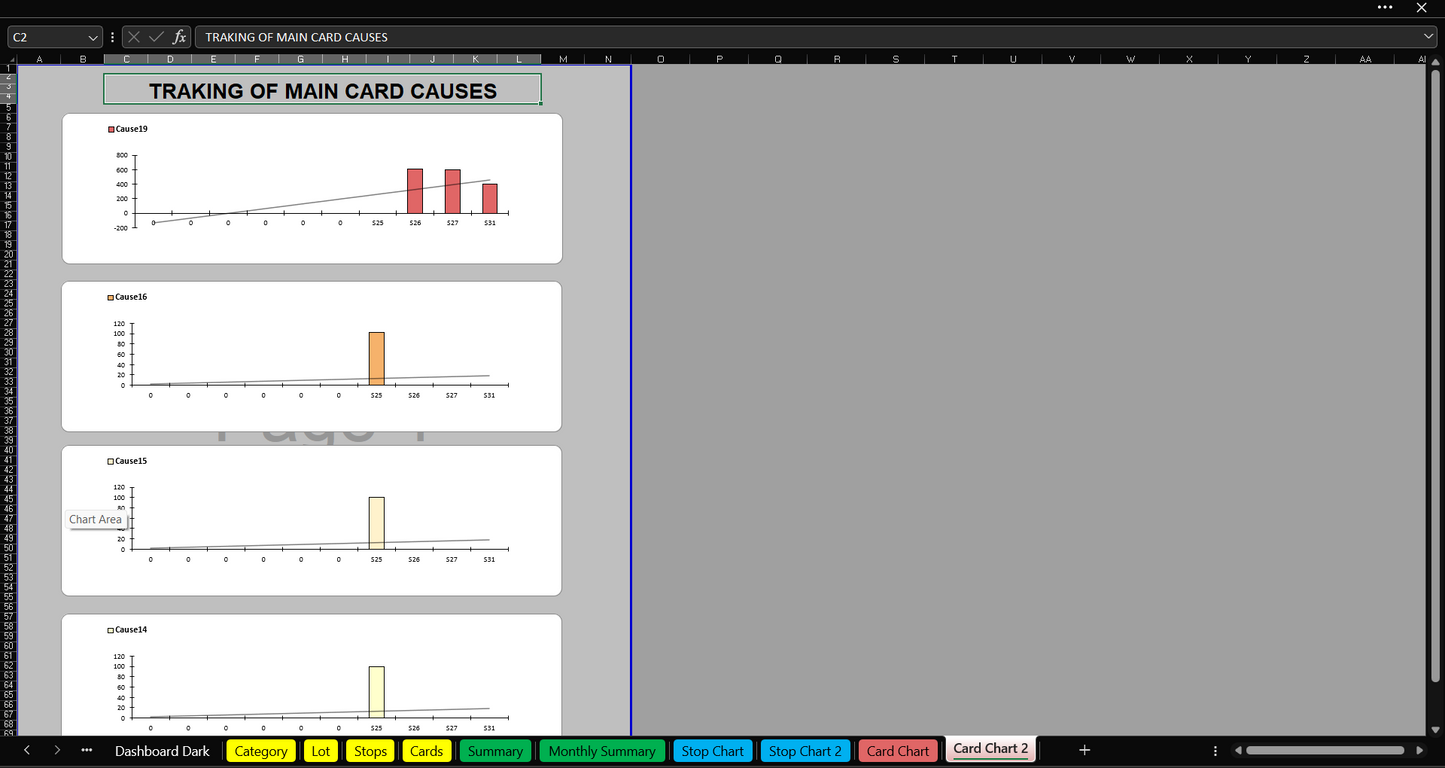
7. Tracking the main causes of rejects and stoppages
- Summary: OEE and quality monitoring graph by daily batch and team
- Monthly review: OEE monitoring graph and cumulative batch quality per month to analyze trends over a longer period
8. Pareto tracking of main causes of scraps and stoppages
- Shutdowns Graph: Pareto graph of major shutdowns over the last 4 weeks
- Stops Graph 2: Time tracking graph of main stops
- Cartons Chart: Pareto chart of major scraps and reworks over the last 4 weeks
- Scraps graph: Time tracking graph of main scraps
9. Others
- Pivot tables for personalized analyses,
OEE monitoring: Methodology and Applications
To guarantee optimized monitoring, you will need to check these few steps:
- Enter the stations of the line, the causes of rejects and the causes of stops
- Fill the databases: production campaign, stoppages and scraps
- View and analyze the performance indicators of your production line
- Implement actions to improve the performance of your equipment
Use this tool to deploy TPM (Total Productive Maintenance) simply, quickly and efficiently. It is a resource used by leaders in the automotive industry, essential in today's competitive industrial context. Save time and resources and focus on improving your performance.
Simplified tracking software
This Excel model for OEE calculation is easily deployed within your organization and does not require any particular technical skills for its use. However, it is strongly recommended to provide a demonstration for managers and operators, in order to facilitate your first steps in monitoring the OEE and understanding this indicator.
Optimization and Advanced Management of Production
For optimal monitoring, we support you step by step in setting up a complete solution to integrate data from your existing ERP, MES , SCADA, etc. systems. This approach streamlines data entry for operators and enriches KPI analysis for managers, making it easier to evaluate improvement measures . To find out more about our support offers, do not hesitate to consult our support offers page and the functionalities of our OEE software.
🎯 Boost your production with this tool, used by leaders in the automotive industry. Save time and resources by aiming for operational excellence.
This document is available on the Excel editor: a direct access link will be sent to you after purchase.
Compatible with Microsoft Excel 2016 and later.
Does not contain macros, works on several simultaneous workstations via Excel Online, it is easily adaptable and modifiable according to your specific needs.
|
💡 Easy to use Immediate deployment |
⏱️ Instant delivery After order |
📞 Support Assistance when needed |
Key Features
Industries
- Automotive
- Aerospace and defense
- Agri-food
- Pharmaceutical industry and medical devices
- Metallurgy and steel industry
- Paper and packaging
- Electronics and semiconductors
- Textiles and clothing
- Manufacturer
Integration Time
- Immediate
Compatibility


FAQs
What is OEE?
How does OEE calculator software help industries?
What are the key components of the software?
What are the steps to monitor and improve OEE?
Does the software work with Excel?
Do I need technical skills to use the software?
How can this software help me deploy TPM (Total Productive Maintenance)?
Is the software suitable for existing systems (ERP, MES, SCADA)?
How can I access the software after purchase?
Which industries can benefit from this software?
Customer Reviews
je suis satisfait de cet outil de suivi, cela m'a permis de suivre et améliorer facilement la performance de ma ligne de production.
Un outil pratique que je recommande pour suivre efficacement le TRS.
Cet outil Excel de suivi du TRS est indispensable pour tout responsable de prod qui vise à améliorer facilement l'efficacité de ses opérations industrielles.

I have implemented it on my press line for vehicle door panels, this tool have significantly improved our operations. it allow us to track production efficiency, identify major causes of downtime, and update our PDCA cycle. thank you team for supporting us !
A must for any manufacturing operation looking to boost productivity and reduce downtime.
blog posts
View all-

Everything you need to know about the FMEA meth...
Find out everything there is to know about FMEA – the method for analyzing failure modes, their effects and their criticality. Learn how FMEA can transform your processes by proactively...
Everything you need to know about the FMEA meth...
Find out everything there is to know about FMEA – the method for analyzing failure modes, their effects and their criticality. Learn how FMEA can transform your processes by proactively...
-

Digital tools: how do they transform innovation?
As the world is constantly changing, many organizations are trying to keep pace with the latest innovations. Indeed, competition is tough to create better and more advanced products. The main...
Digital tools: how do they transform innovation?
As the world is constantly changing, many organizations are trying to keep pace with the latest innovations. Indeed, competition is tough to create better and more advanced products. The main...
-

2024 trends: which digital innovation to invest...
Digital innovation trends are of paramount importance in the modern world. It is important to incorporate the latest trends into your business in order to attract more customers and satisfy...
2024 trends: which digital innovation to invest...
Digital innovation trends are of paramount importance in the modern world. It is important to incorporate the latest trends into your business in order to attract more customers and satisfy...


