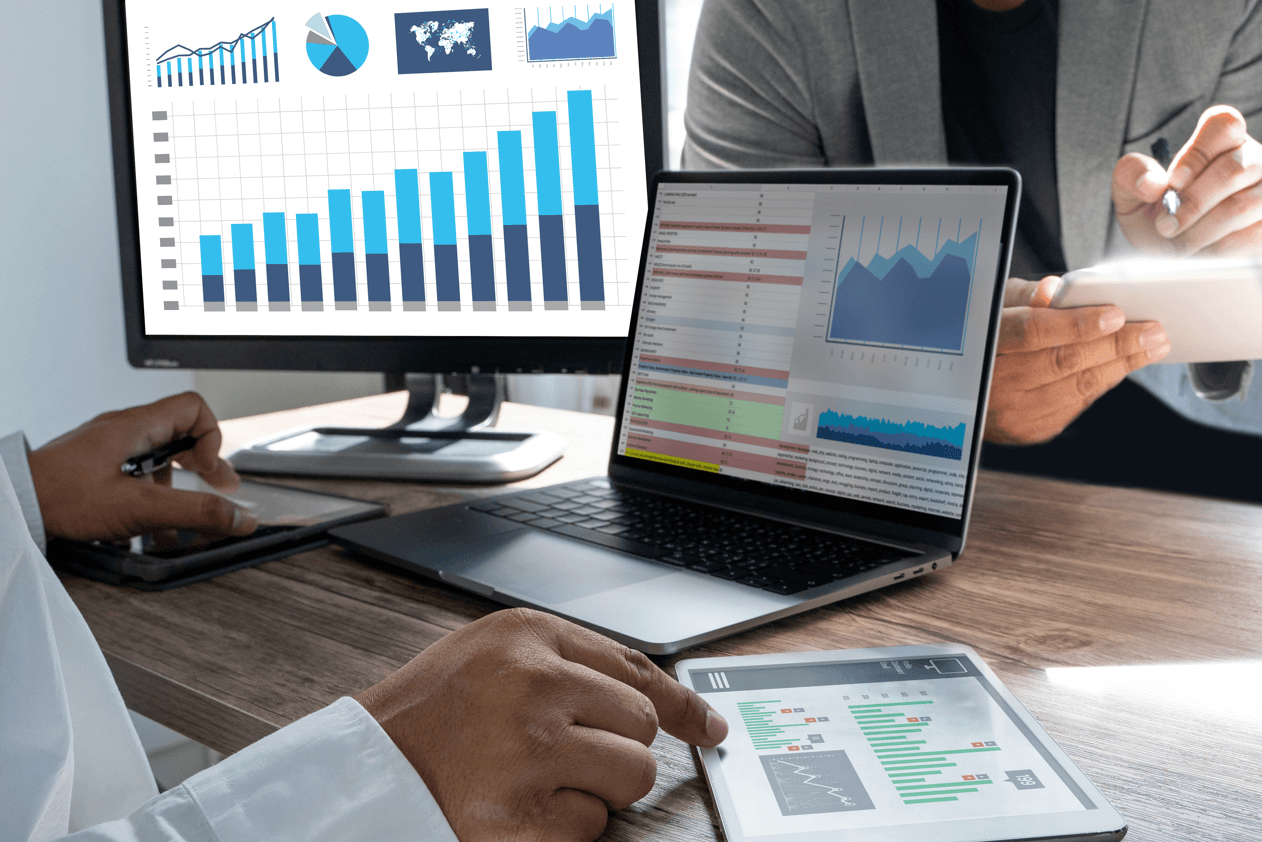
Manufacturing Dashboard to optimize Industrial Performance

The production dashboard is a central element in the industrial field. It is used to plan, coordinate and optimize production processes. This guide will help you understand the key components of an effective production dashboard and how it can help improve the productivity and efficiency of your plant.
Introduction to the Production Table
A production dashboard is a visual tool that helps manage and improve workflows in manufacturing. It displays important information for manufacturing tracking, such as tasks to be completed, assigned personnel, and deadlines, allowing for improved coordination and communication between different departments in the plant.
Importance of the Production Dashboard
Optimal management of production processes is crucial for industries. A well-designed production board allows to effectively monitor production, identify critical points and adjust actions in real time, which would allow a reduction in costs and production times, an improvement in product quality and, ultimately, an increase in customer satisfaction.
Type of Production Tables
1. Manufacturing Tracking Dashboard
The manufacturing tracking board allows you to track the production progress of each product in real time. It helps to optimize the manufacturing process by providing a detailed view of the production status.

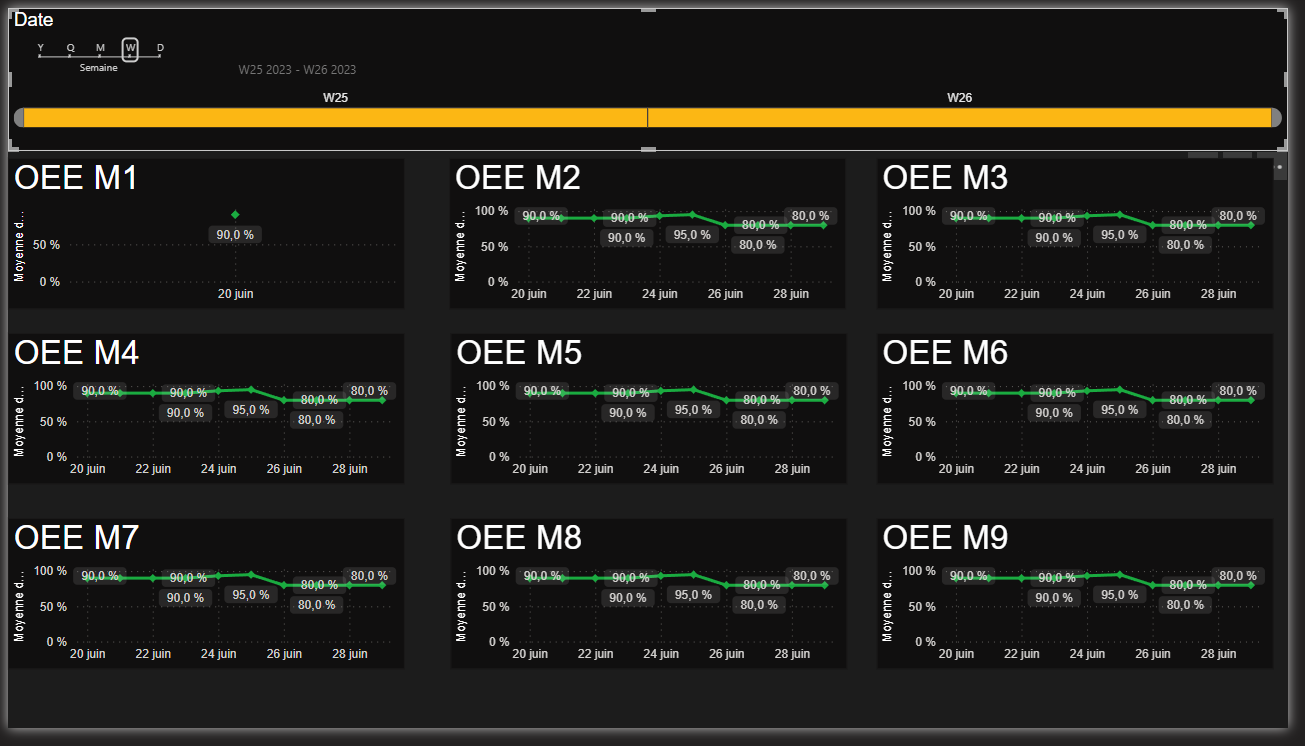
2. OEE (Overall Equipment Effectiveness) Monitoring Dashboard
Monitoring OEE is essential to assess the efficiency of machines and production lines, identify areas for improvement, and optimize availability, performance and quality in production processes.
Link to download a OEE tracking dashboard
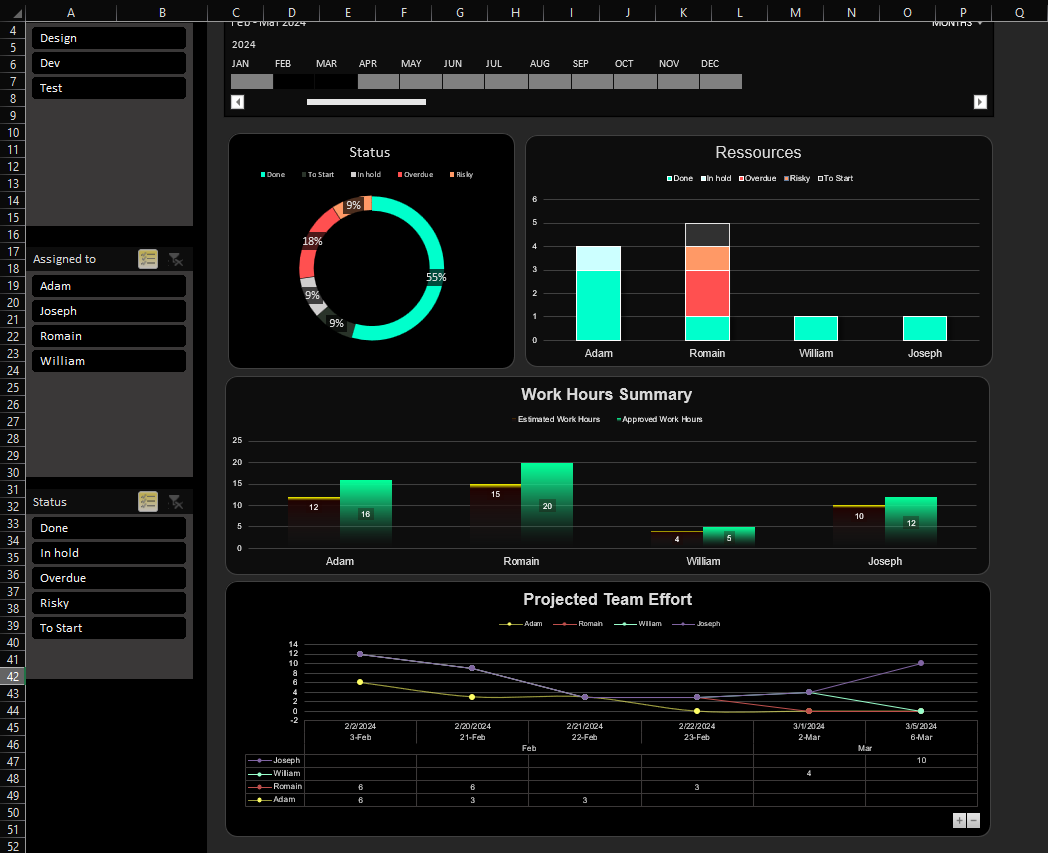
3. Personnel Monitoring Dashboard
This table monitors the hours worked by each employee and the tasks completed during their working time, which is crucial for human resource management and improving employee productivity and satisfaction.
Link to download a project monitoring dashboard
4. Inventory Management Dashboard
The inventory management dashboard provides a clear view of current stock levels, open orders, and replenishment needs, facilitating optimized inventory management and avoiding overstocks or stockouts.
Link to download a Stock Tracking Dashboard

5. Order Tracking Table
The order tracking dashboard helps to efficiently manage and track the status of customer orders from receipt to delivery, ensuring better customer satisfaction and optimized supply chain management.
Link to download an order tracking dashboard
Methodologies for Creating a Production Table
-
Defining Goals: Identify clear, measurable goals you want to achieve with your dashboard, such as optimizing yield or quality.
-
Methodology Selection: Choose one or more production management methodologies (such as Lean or Agile) that will best align your dashboard with your production goals.
-
Identifying Indicators: Determine the key performance indicators (KPIs) and sub-indicators to include in your dashboard to effectively measure the achievement of your objectives.
-
Data Collection: Identify the data sources needed for your indicators and put in place mechanisms to collect this data regularly and reliably.
-
Choosing a Dashboard Tool: Select a dashboard tool or software that meets your data visualization, analysis, and sharing needs.
-
Dashboard Design: Configure your dashboard using the chosen tool or software, integrating your indicators and structuring the display in a clear and intuitive way.
-
Test and Validation: Test your dashboard with real or simulated data to ensure its accuracy and relevance. Adjust it as needed based on feedback and results.
-
Deployment and Training: Deploy the dashboard to the relevant users and ensure they are trained and comfortable using it.
-
Monitoring and Continuous Improvement: Use the dashboard to track production performance regularly and identify areas for improvement. Review and adjust the dashboard as needed to keep it aligned with evolving goals and needs.
-
Periodic Review and Adjustment: Schedule periodic reviews of your dashboard to ensure it continues to meet the needs of your organization and adjust it accordingly if necessary.
Technologies and Tools for an Optimized Production Table
The use of cutting-edge technologies and digital tools is essential to optimize the creation and management of production tables. Production management software provides sophisticated features such as automated planning, real-time monitoring, and industrial performance analysis for accurate and efficient production management. In addition, organizations also have the option of creating dashboards using accessible tools such as Power BI , which further improve the visualization and analysis of production data.
Case Studies and Real Examples
- Tesla, Inc.: By taking an innovative approach to designing its production boards, Tesla has successfully revolutionized the automotive industry by reducing lead times and improving the quality of its electric vehicles.
- Amazon: By optimizing its production tables, Amazon has managed to master its logistics processes, allowing it to offer unbeatable delivery times and unrivaled customer satisfaction.
Discover our selection of the 10 best Excel and Power BI models in this video:
Practical Tips and Tricks
Here are some tips for creating an effective production chart:
-
Regularly evaluate the effectiveness of your board and adjust it according to changing production needs.
-
Train your staff on how to use the production board optimally.
-
Integrate advanced technology tools to improve board accuracy and efficiency.
Additional Resources
For a thorough understanding and optimal application of production board design and management, exploring specialized resources and attending relevant training courses are highly recommended to meet your specific needs.
If you aspire to master Power BI to improve project management, we suggest you explore Power BI training , designed to strengthen your skills in creating effective dashboards and analyzing data.
To dive deeper into managing collaborative project workflows using MS Project, Power BI, SharePoint, and Power Automate, check out our full training here .
The video below presents an Excel Tool including an advanced dashboard used for tracking the Synthetic Rate of Return (SOR). Please note that the video is in English
For advanced solutions, discover the features of OEE software designed for efficient coordination between different plant managers.


1 comment
Je suis un manager qualifié dans un hôpital public