

Public Shared Dashboards: Full Overview of Templates to Copy
Publicly shared dashboards are revolutionizing data management and business decision-making. Thanks to a selection of interactive templates accessible to everyone, it's now possible to explore, copy, and adapt ready-to-use dashboards to manage your projects, track key indicators, or analyze your sales. This article presents, one by one, the best models shared on our site, each with its direct link to use or duplicate within your organization.
Why choose a publicly shared dashboard?
A publicly shared dashboard offers instant visibility into your KPIs, fosters collaboration, and accelerates the dissemination of best practices. These models, designed for use without complex configuration, allow you to:
- Centralize information and key indicators for all team members
- Save time with ready-to-use and adaptable structures
- Promote transparency and team alignment, even remotely
- Easily share your analyses, both internally and externally
The simplicity of duplicating and adapting these templates makes public dashboards a driver of agility and performance for all professions.
- Public templates available: 12
- Adoption rate: 68%
- Average duplication time: 2 min
- Active users: 4,500
Template 1: Sales Performance 2 – Comprehensive Sales Tracking
The Sales Performance 2 template is a comprehensive BI dashboard for visualizing commercial performance in real time. It presents sales by segment, region, product, and period, while integrating dynamic charts and interactive drill-down. Ideal for commercial management, this model is suitable for both SMEs and large companies wishing to analyze their sales funnel.
Use this template / Create a copy
Template 2: Top 50 Tourist Destinations – Sectoral Analysis
The Top 50 Tourist Destinations dashboard allows you to analyze the main global tourist destinations according to different axes: attendance, annual evolution, origin of visitors, etc. Perfect for tourism professionals or market analysts, it offers a macro and micro view thanks to dynamic filters.
Use this template / Create a copy
Template 3: Downtime, OEE & Stop Causes – Industrial Performance
This model is designed for tracking industrial performance: availability rate, causes of stoppages, OEE (Overall Equipment Effectiveness). It allows for rapid identification of areas for improvement in production and optimization of maintenance. Industrial managers will find it a key tool for driving operational excellence.
Use this template / Create a copy
Template 4: Electric Vehicles 2026 – Emerging Market Monitoring
The Electric Vehicles 2026 dashboard brings together all key data for the electric vehicle sector: market shares, sales volumes, trends by continent, and main players. A reference tool for industrial decision-makers, startups, or analysts wishing to anticipate developments in the automotive sector.
Use this template / Create a copy
Template 5: Shopify Sales Analysis – High-performing E-commerce
This Shopify-specific template offers a detailed analysis of e-commerce sales: revenue, average order value, conversion rate, performance by product or marketing channel. It is aimed at e-commerce merchants looking to optimize their business through clear and actionable data visualization.
Use this template / Create a copy
Template 6: Advanced Cybersecurity & AI Incident Analysis
The Advanced Cybersecurity & AI Incident Analysis dashboard centralizes cybersecurity and AI incidents: attack typologies, reaction times, business impacts, and sectoral benchmarks. An asset for IT managers and CISOs wishing to manage their security level and anticipate emerging threats.
Use this template / Create a copy
Template 7: AI Ecosystem Analysis – Artificial Intelligence Mapping
This dashboard offers an overview of the global AI ecosystem: investments, major players, uses by sector, R&D trends. Perfect for consultants, investors, or enthusiasts wanting to map the dynamics of artificial intelligence in 2026.
Use this template / Create a copy
Comparative table of public dashboards
| Template name | Domain | Main usage | Direct link |
|---|---|---|---|
| Sales Performance 2 | Sales | Sales tracking | <a href="/en/shared/bi-dashboard/1a496ca2-a25d-4a91-ac62-b0e921610ba5" target="_blank">Access</a> |
| Top 50 Tourist Destinations | Tourism | Sectoral analysis | <a href="/en/shared/bi-dashboard/75501a8c-ac2d-4a27-a40e-5f2b5dd900fc" target="_blank">Access</a> |
| Downtime, OEE & Stop Causes | Industry | Production performance | <a href="/en/shared/bi-dashboard/4a822a01-0f31-4609-9895-70cfd895670a" target="_blank">Access</a> |
| Electric Vehicles 2026 | Automotive & energy | Market trends | <a href="/en/shared/bi-dashboard/3fec366e-bba0-4db0-8a27-0e2fa10e9190" target="_blank">Access</a> |
| Shopify Sales Analysis | E-commerce | E-shop analysis | <a href="/en/shared/bi-dashboard/de9063e0-be1e-41be-85a4-a96bd933d3c0" target="_blank">Access</a> |
| Advanced Cybersecurity & AI Incident Analysis | Cybersecurity & AI | Incident management | <a href="/en/shared/bi-dashboard/d8e03cac-3860-4f29-9821-f61dfd6e77d7" target="_blank">Access</a> |
| AI Ecosystem Analysis | Artificial intelligence | Mapping & monitoring | <a href="/en/shared/bi-dashboard/9208dc1d-3d67-481b-9e59-adbc9782d4bb" target="_blank">Access</a> |
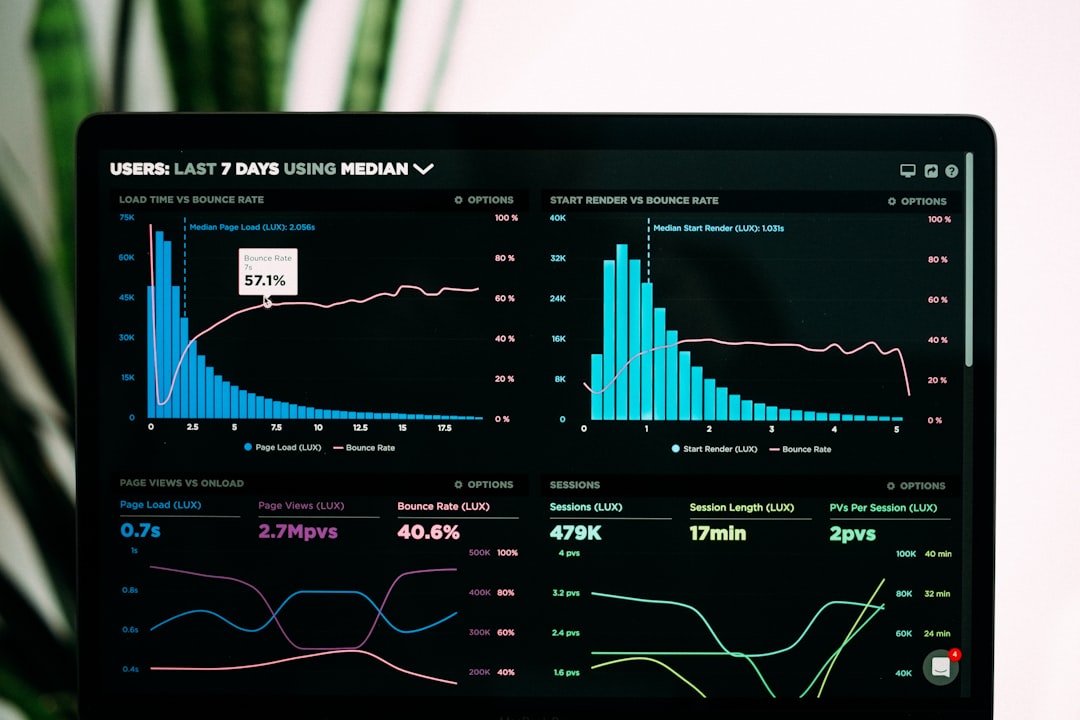
Best practices for personalizing your public dashboard
To maximize the impact of a publicly shared dashboard, it is recommended to:
- Customize visuals and filters according to your own data
- Add key indicators specific to your sector or project
- Ensure regular updates of data sets
- Share the read-only link to preserve the integrity of the original model
Public dashboards are also an ideal starting point for building your own custom dashboards.
Public dashboards are formidable accelerators of innovation and automation for all professions. They allow everyone to quickly adopt the best practices of digital reporting.
— Adam Baghdadi, Founder i40Pilot
- What is a publicly shared dashboard?
- A publicly shared dashboard is a dashboard accessible to everyone via a web link, without access restrictions. It allows you to visualize and analyze data in real time, and can be copied or adapted for personal or professional use.
- How do I use or copy a public dashboard template?
- Simply click on the "Use this template / Create a copy" link to integrate the model into your space. You can then customize it with your own data and indicators.
- What are the advantages of public dashboards for businesses?
- They facilitate the dissemination of best practices, accelerate the implementation of reporting, and promote collaboration through total transparency of data and KPIs.
- Can I connect my own data to these templates?
- Yes, all dashboards presented can be linked to your own data sets, either via manual import or automated synchronization.
- Which sectors can benefit from these dashboards?
- All sectors: industry, commerce, tourism, cybersecurity, AI, finance or e-commerce will find models adapted to their specific challenges.


