Steps to Create Gantt Chart with MS Project

Table of Contents
- Introduction
- What is a Gantt Chart?
- Tools and Software for Creating a Gantt Chart
- How to Create a Gantt Chart
Introduction
Businesses are constantly looking for ways to optimize their processes to remain competitive and meet market demands. It is in this context that the Gantt chart has emerged as an essential tool for planning, tracking, and successfully implementing your projects, and is considered the most powerful model for structured project management , with a waterfall approach.
This article offers a comprehensive guide to the Gantt chart. You'll discover what it is, why it's so important, and how it can transform the way you manage projects.
What is a Gantt Chart?
Definition
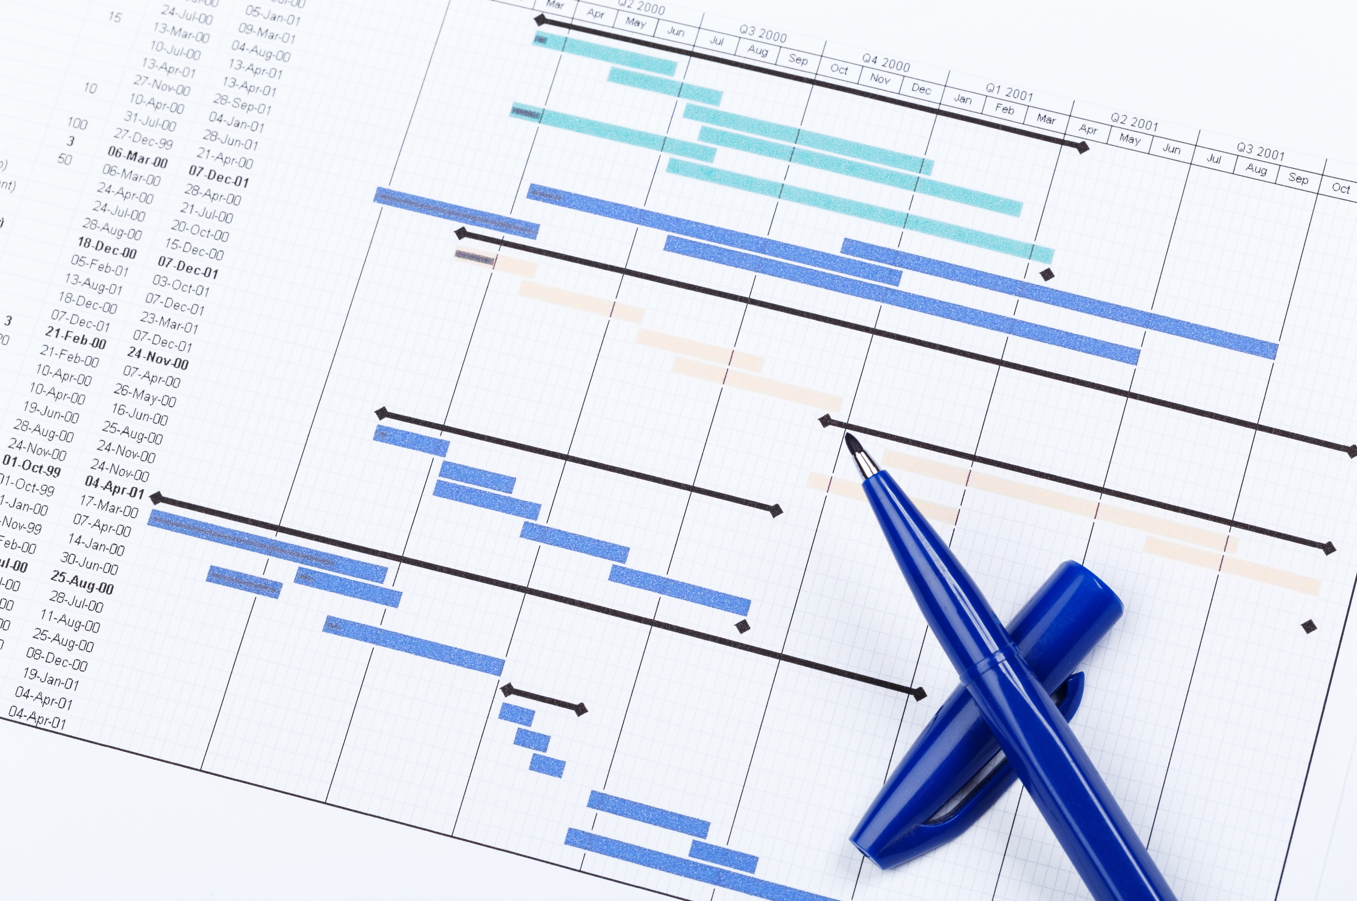
A Gantt chart is a project management tool that graphically represents the schedule of tasks on a timeline. Each task is illustrated by a horizontal bar whose position and length correspond respectively to its start date, duration, and end date. This makes it easy to visualize the tasks to be completed, their deadlines, and the dependencies between them.
Historical
The Gantt chart is named after Henry L. Gantt , an American mechanical engineer and management consultant. In the early 20th century, between 1910 and 1915 , Gantt developed this chart to improve the efficiency of industrial processes. His invention was quickly adopted in various industries for project planning and monitoring.
Importance
Despite its age, the Gantt chart remains a relevant and widely used tool today. Its simplicity and effectiveness make it a valuable ally for project managers. It allows for planning and tracking task progress and facilitates communication within the team. By providing a clear overview, it helps identify potential delays and take timely corrective action.
Tools and Software for Creating a Gantt Chart
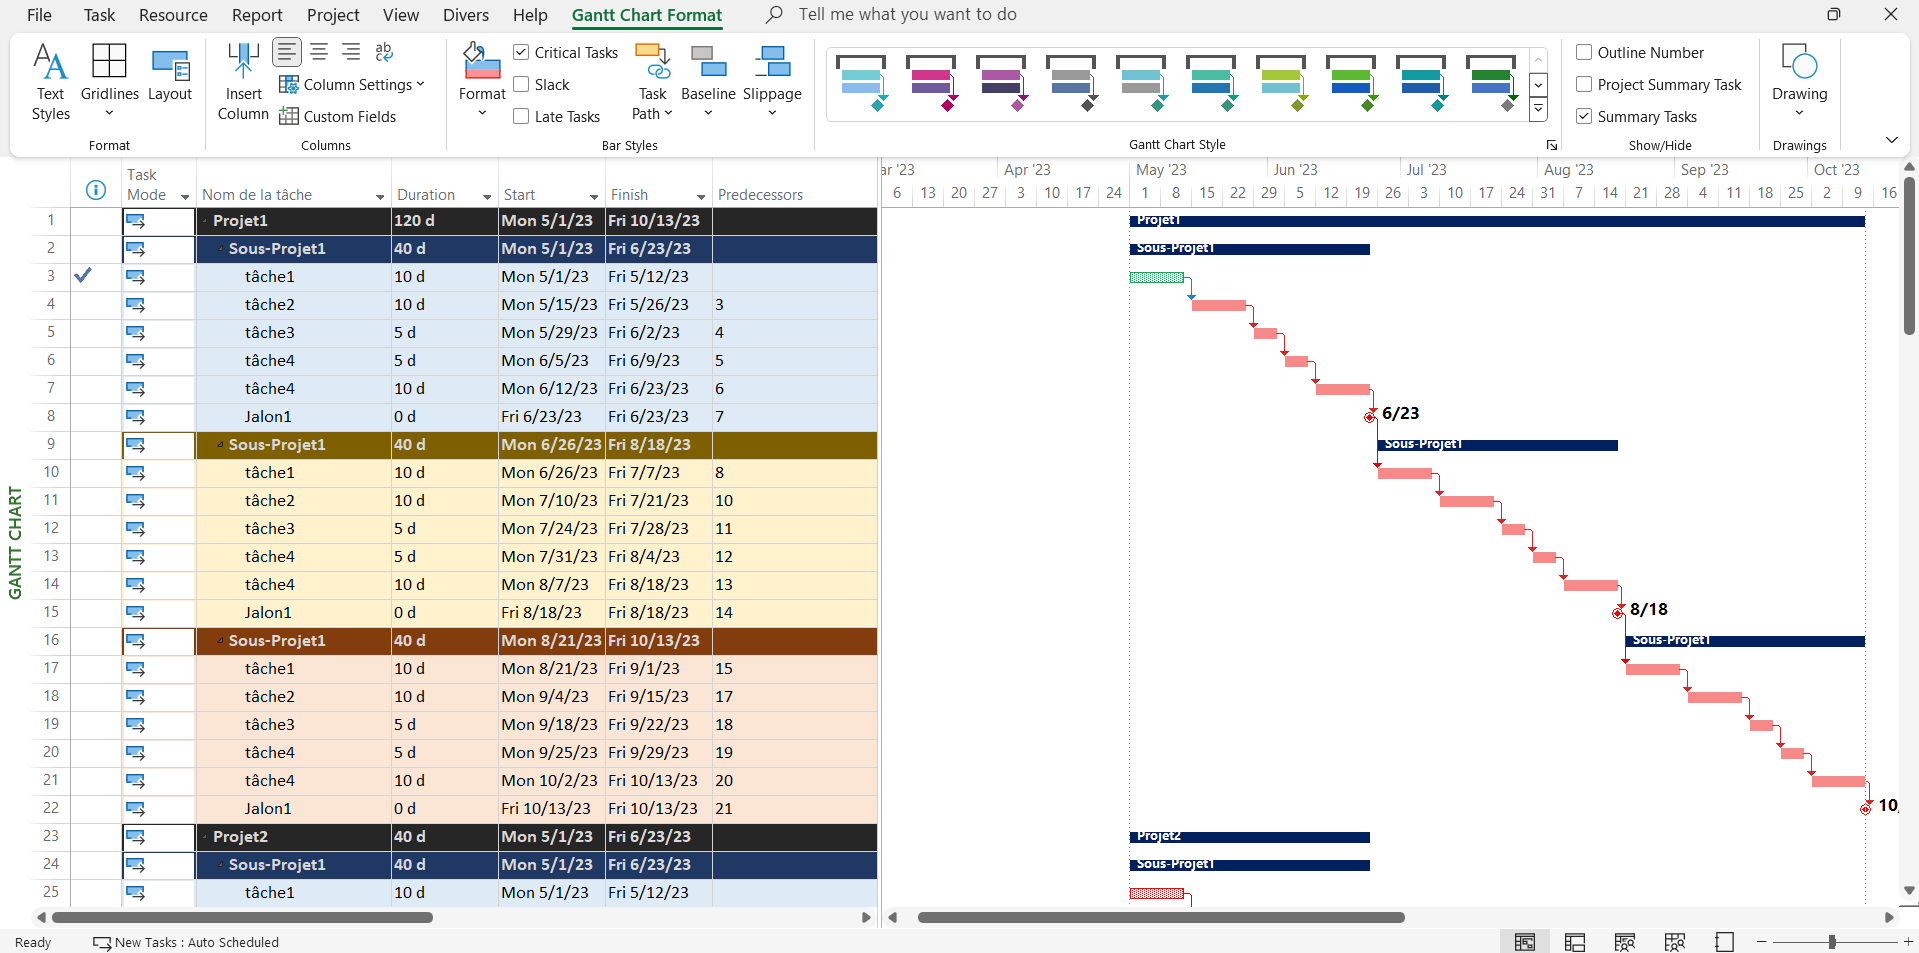
Microsoft Project
Microsoft Project is one of the most recognized project management tools. It offers a comprehensive range of features for creating detailed Gantt charts, including adding milestones, setting baseline dates for each task, and tracking project progress in real time. Its ability to visually represent tasks and milestones facilitates communication between team members and stakeholders.
Trello
Trello is a project management tool based on the Kanban system. While it doesn't offer a native Gantt chart, extensions like Elegantt allow you to visualize your Trello boards as a Gantt chart. This is an ideal solution for small teams or less complex projects.
Asana
Asana offers a timeline view that works like a Gantt chart. You can add tasks, set dependencies, adjust start and end dates, and add milestones to mark key project steps. Its intuitive interface makes it easy to collaborate and track your project.
GanttProject
GanttProject is an open-source software dedicated to creating Gantt charts. It allows you to add tasks, milestones, manage dependencies, and track progress. Although it's free, it offers features comparable to some paid tools.
Pilot
Pilot is a modern project planning application dedicated to industrial maintenance. It allows you to visualize interventions in the form of Gantt charts and schedule interventions with the assistance of AI agents.
How to Create a Gantt Chart
Creating an effective Gantt chart is a multi-step process that requires detailed planning. Here are the enhanced steps to guide you through this process:
Step 1: Identify Tasks and Subtasks
- List all the tasks needed to complete the project.
- Break down complex tasks into subtasks for better management.
- Use a Work Breakdown Structure (WBS) to organize tasks hierarchically.

Step 2: Determine Dependencies between Tasks
- Identify the relationships between tasks (predecessors and successors).
- Define dependency types (finish-start, start-start, finish-finish, start-finish).
- Note any constraints that may influence the order of tasks.

Step 3: Estimate the Duration of Each Task
- Estimate the time needed for each task in days, weeks, or months.
- Consider the available resources and their capacity.
- Build in safety margins for contingencies.
Step 4: Set Start and End Dates
- Set start dates based on dependencies and availability.
- Calculate end dates by adding the duration to the start date.
- Adjust the schedule to avoid conflicts and work overload.
Step 5: Add Milestones
- Determine the key milestones of the project (major deliverables, end of phases).
- Include milestones in the diagram to mark important steps.
- Use benchmark dates to track progress against goals.

Step 6: Adjust the Start Dates, Durations, and End Dates for Tracking
- Check the diagram to identify any overlaps or inconsistencies.
- Adjust the dates according to actual constraints.
- Modify durations if initial estimates were inaccurate.
Step 7: Integrate Resources
- Assign resources (human, material) to each task.
- Check resource availability to avoid conflicts.
- Use software resource management to optimize allocation.
Step 8: Add Reference Dates for Each Task
- Set reference dates or deadlines for each task.
- Use these dates for tracking and to trigger alerts in case of delays.
- Make reporting easier by having clear points of comparison.
Step 9: Visual Representation with the Help of Software
- Use the software's graphics features to improve readability.
- Customize colors and styles to differentiate tasks, milestones, and phases.
- Generate specific views (by resource, by phase, by priority) for different stakeholders.
Discover a Ms project Gantt chart with advanced formatting.
Example with Microsoft Project
- Represent tasks and milestones with distinct bars and symbols.
- Use the critical path to identify tasks that directly influence the project finish date.
- Create visual reports to present project status to stakeholders.
Step 12: Set up a Monitoring and Adjustment System
- Update the chart regularly with actual task progress.
- Adjust dates and durations if there are any changes or delays.
- Communicate updates to the team and stakeholders.
Download a free Excel Gantt chart and start applying it to your projects.
Discover +7 Gantt charts available in Excel, Ms Project and Power BI formats.
Video demonstration of creating an advanced schedule with formatting in MS Project