Subscribe to our newsletter
Be the first to know about the latest solutions
Digital Factory
T14/ Power BI - Tutorial: Connect data from a synchronized SharePoint List to Ms Project
Couldn't load pickup availability
Paid Tutorial: An access link will be sent to you after purchase.
In this Microsoft Power Automate tutorial, you will learn how to connect a SharePoint list synchronized to a Planning Ms project to Power BI.
👉 Discover the full training program
Create advanced reports to track your complex projects in real time.
To get started, on the Home tab, click Get Data . In the menu that appears, click More to see more data source options. In the search box, type SharePoint and the SharePoint List data source should appear in the list, click it .
Click on Sign in .
Now you need to copy and paste the link to your SharePoint site . Make sure you have this link handy. Select the 2.0 implementation, this is important to ensure the best compatibility and performance. Once you have done this, click OK .
Now you can select the lists you want to connect. To do this, simply check the boxes next to their names. Once you have selected all the lists you want, click Upload . And there you have it, you have now connected your SharePoint data.
Continuing our demo, we will now prepare the data for analysis. On the Home tab, click Transform Data . You will see that the Power Query editor opens. The first thing we will do is update the data types. To do this, select the column whose type you want to change. Next, on the Transform tab, we will change the data type of the columns. If you have columns with dates, make sure to change the type to Date . If you have numbers, choose Decimal . It is very important to verify that the data has the correct type, it is crucial for creating reliable and accurate reports. By following these steps, you will ensure that your data is correctly formatted and ready for analysis in Power BI.
To apply your changes, return to the Home tab and click Close and Apply .
For more basic editing of your data, you can also click Data View in the ribbon on the left. This feature allows you to make quick edits without having to enter the Power Query editor.
The column you see connected in Power BI are the ones that exist in the default SharePoint view. If you want to add new columns, you either need to view them in SharePoint or map new columns from MS Project.
First, open your MS Project schedule that is synced with SharePoint. Then, on the File menu, click Info . From there, you can start mapping the new fields. In our case, we'll map the Baseline Start and End Date columns.
Once you've mapped the new columns, click OK . Don't forget to save your changes to sync the new data.
Now, let's go back to SharePoint. In the default view, click on the three vertical dots and then click on Edit this view . Check the columns we just mapped.
And there you have it, you have added new columns to your data source.
Refresh your Power BI report, this will load the new columns into your report data. You should now see the new columns you added from SharePoint appear in your report data.
You now need to update the formats of the reference date columns to date, either from the Power Query editor or from the Data View.
To go further in our analysis and in order to create a report on the workload, we can add the Work and Summary columns. This will allow us to analyze the time spent by each resource and on each task. For the rest of this video, we will therefore map and connect these two columns to Power BI. This data is essential for a good analysis of the schedule and resources. By incorporating these elements into our data model, we will be able to have a detailed view of the distribution of work, which will help us optimize resource management and improve planning.
To integrate the Work and Summary columns into your Power BI report, you'll repeat the actions we performed in this tutorial: namely, mapping the fields from your Project schedule, displaying these columns in the default SharePoint view, refreshing the data in Power BI, and preparing this data in the Power Query editor or Data View.
To effectively leverage the Work column in our analysis, we need to transform it into a Decimal . To do this, we'll use Power Query in Power BI. First, open Power Query and click Refresh . Next, select the Work column. On the Home tab, click Replace Data . This will open a new window where you can make replacements to your data. In this window, replace "hour" with a blank field, and do the same for the space. Make sure to make both of these replacements to properly prepare the column for transformation. Now that the hours and spaces have been removed, you can change the type of the Work column to a Decimal .
Now connect the Summary column using the same steps.
Thanks for watching this tutorial. In the next part of this series, we'll show you how to leverage this data to create meaningful reports. We look forward to seeing you again for more of this tutorial.
Share
- Access your product in 30 seconds: steps 👇
- Title
- Title

FAQs
How will I receive links to the videos?
Links to the videos will be sent to the email address you used to place your order. Be sure to check your inbox and spam folder.
Will I have unlimited access to videos?
Yes, you will have unlimited access to videos for life. You can watch them as many times as necessary to fully assimilate the content.
Are the videos downloadable?
No, the videos are not downloadable. They are only accessible online via the links provided after ordering.
Can I share video links with others?
No, video links are strictly personal and should not be shared. They are intended solely for the use of the buyer.
Is there support available if I have questions about the content of the videos?
Yes, if you have any questions about the content of the videos, you can contact us at [hello@digitalfactory.store]. We would be delighted to help you.
Subscription offers
Subscription - Access to Excel, Power BI and Ms project tutorials and models
Corporate Pack
- No renewal constraints
- Full access to all tutorials:
- MS Project: Planning, Resources
- Power BI: Data Preparation, Dashboards
- Power Automate: Workflow Automation
- Full access to all models:
- Project management, Operational efficiency, Lean,...
- Premium Dashboards Included
- Unlimited downloads
- Personal space included
- 30 minute support included
Monthly Subscription
- Full access to all tutorials:
- MS Project: Planning, Resources
- Power BI: Data Preparation, Dashboards
- Power Automate: Workflow Automation
- Full access to all models:
- Project management, Operational efficiency, Lean,...
- Premium Dashboards Included
- Unlimited downloads
- Personal space included
- 30 minute support included
Annual Subscription
- All the advantages of the monthly
- Save 36% compared to monthly
- Priority consultation with an expert
- Updates and new models every week
Recommendations
-
J8/ Model — Calculation and monitoring of OEE Excel 2025 ...
4.94 / 5.0
(32) 32 total reviews
Regular price From €159,00Regular priceUnit price / per€279,00Sale price From €159,00Sale -
J9/ Budget and Deliverables Tracking Template for Business
3.67 / 5.0
(6) 6 total reviews
Regular price From €59,00Regular priceUnit price / per€249,00Sale price From €59,00Sale -
J28/ Power Bi Project Management Template to download
4.0 / 5.0
(8) 8 total reviews
Regular price From €0,00Regular priceUnit price / perSale price From €0,00 -
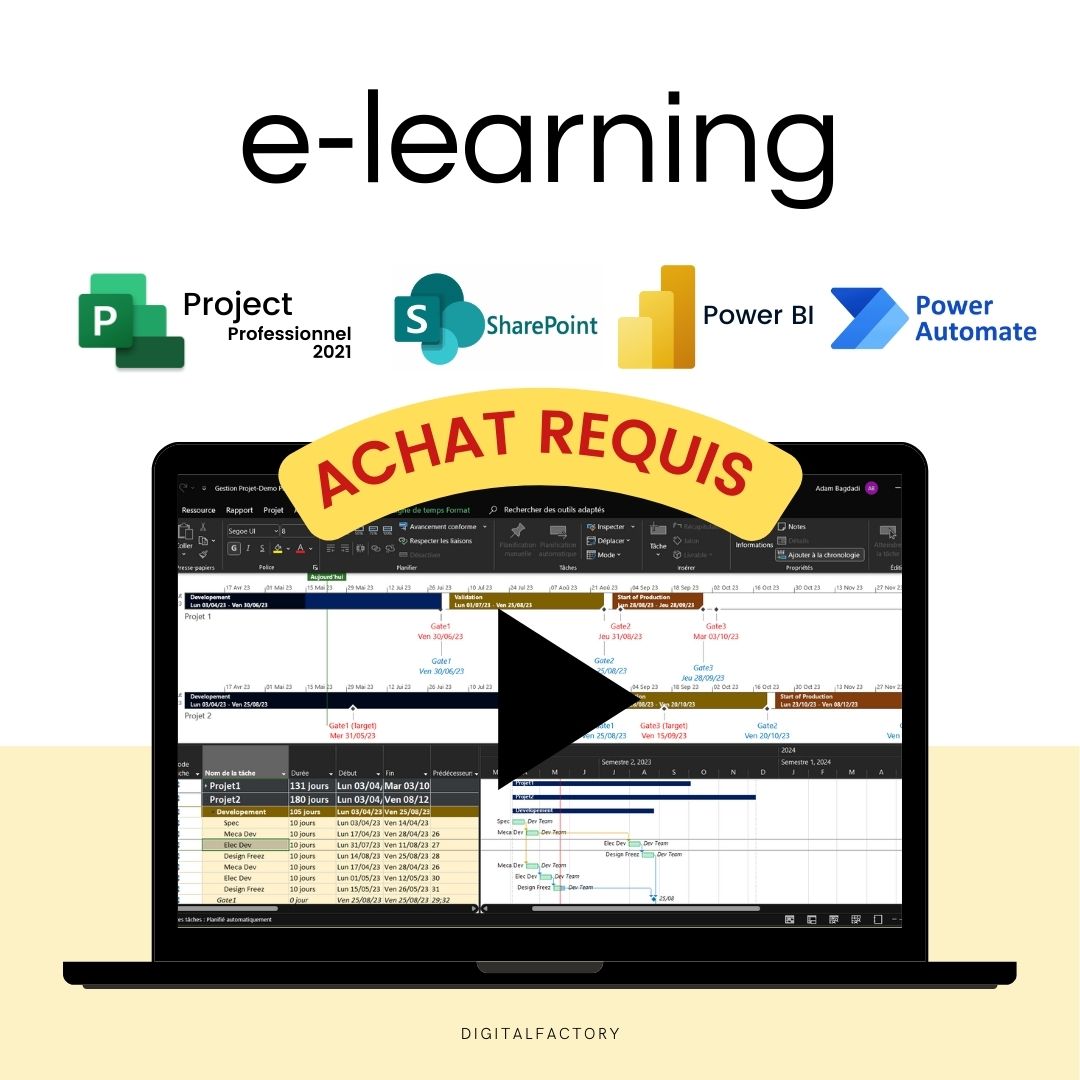
J27/ MS Project Gantt Planning Template to download
Regular price From €69,00Regular priceUnit price / perSale price From €69,00 -
J10/ Project Management Excel Model for project managers
4.82 / 5.0
(11) 11 total reviews
Regular price From €49,00Regular priceUnit price / per€219,00Sale price From €49,00Sale -
J30/ Power BI Model - Risk Analysis (Amdec)
Regular price From €0,00Regular priceUnit price / perSale price From €0,00 -
J7/ Model — Example FMEA Excel Process - Dashboard - RPN ...
4.44 / 5.0
(9) 9 total reviews
Regular price From €59,00Regular priceUnit price / perSale price From €59,00 -
C1/ ebook: White Paper - From vision to action, the futur...
5.0 / 5.0
(4) 4 total reviews
Regular price €39,00Regular priceUnit price / perSale price €39,00 -
A2/ Advanced OEE Excel Template - Powerful Manufacturing ...
4.87 / 5.0
(23) 23 total reviews
Regular price From €99,00Regular priceUnit price / per€99,00Sale price From €99,00 -
A1/ Template - Budget and project deliverables tracking -...
5.0 / 5.0
(3) 3 total reviews
Regular price From €29,00Regular priceUnit price / per€59,00Sale price From €29,00Sale -
A9/ Model - Project Risk Analysis - Google Sheet/Excel
2.0 / 5.0
(1) 1 total reviews
Regular price €39,00Regular priceUnit price / per€149,00Sale price €39,00Sale -
A3/ Model - Process FMEA - Google Sheet/Excel - Pro
4.0 / 5.0
(1) 1 total reviews
Regular price From €29,00Regular priceUnit price / per€59,00Sale price From €29,00Sale -
A5/ Model - Dasboard KPI Planning MS Project - Excel - Go...
Regular price From €49,00Regular priceUnit price / perSale price From €49,00 -
A5/ Excel FMEA Template - Google Sheet/Excel - Basic
3.67 / 5.0
(3) 3 total reviews
Regular price €0,00Regular priceUnit price / perSale price €0,00 -
C2/ Model — OEE Dashboard - Production Tracking - Excel T...
4.0 / 5.0
(3) 3 total reviews
Regular price From €49,00Regular priceUnit price / per€99,00Sale price From €49,00Sale -
A6/ Template — Machine risk analysis — Google Sheet/Excel
Regular price €499,00Regular priceUnit price / perSale price €499,00 -
A8/ Model — Maintenance instructions - Example User Manua...
Regular price From €39,00Regular priceUnit price / perSale price From €39,00 -
A4/ Model — Suppliers assessment — Google Sheet/Excel
5.0 / 5.0
(1) 1 total reviews
Regular price From €9,00Regular priceUnit price / per€29,00Sale price From €9,00Sale -
J6/ Model — Free Excel Production Monitoring File: Exampl...
3.0 / 5.0
(2) 2 total reviews
Regular price €0,00Regular priceUnit price / perSale price €0,00 -
J11/ PDF — TRS - Definition, calculation, benefits and im...
Regular price €0,00Regular priceUnit price / perSale price €0,00 -
J12/ PDF — Industry 5.0: Definition, technology, advantag...
Regular price €0,00Regular priceUnit price / perSale price €0,00 -
J13/ Maintenance Management Excel Model (CMMS)
5.0 / 5.0
(1) 1 total reviews
Regular price From €99,00Regular priceUnit price / perSale price From €99,00 -
J29/ Power BI Model - TRS (Overall Earnings Ratio) Monito...
5.0 / 5.0
(1) 1 total reviews
Regular price From €0,00Regular priceUnit price / perSale price From €0,00 -
J14/ 5S Excel Model: Checklist, Audit and Control for Ind...
Regular price €0,00Regular priceUnit price / perSale price €0,00 -
J15/ Advanced DMAIC Model for your Lean Six Sigma Project...
Regular price €0,00Regular priceUnit price / perSale price €0,00
Any questions?

Contact form
blog posts
View all-
How to reduce the administrative costs of a com...
Introduction to Business Cost Reduction Reducing business costs is essential to maximizing profitability. Accounting, logistics, human resources: the tasks involved are essential, but also costly and time-consuming. However, it is...
How to reduce the administrative costs of a com...
Introduction to Business Cost Reduction Reducing business costs is essential to maximizing profitability. Accounting, logistics, human resources: the tasks involved are essential, but also costly and time-consuming. However, it is...
-
Improve your project management with the Kanban...
Introduction Businesses are facing unprecedented challenges when it comes to project management. Client expectations are rising, deadlines are shrinking, and project complexity is constantly increasing. Faced with these challenges, traditional...
Improve your project management with the Kanban...
Introduction Businesses are facing unprecedented challenges when it comes to project management. Client expectations are rising, deadlines are shrinking, and project complexity is constantly increasing. Faced with these challenges, traditional...
-
How to boost innovation?
Introduction Innovation is no longer a simple competitive advantage: in a context marked by the constant evolution of technologies and customer expectations, also with the acceleration towards industry 4.0 ,...
1 commentHow to boost innovation?
Introduction Innovation is no longer a simple competitive advantage: in a context marked by the constant evolution of technologies and customer expectations, also with the acceleration towards industry 4.0 ,...
1 comment