Subscribe to our newsletter
Be the first to know about the latest solutions
Digital factory
C2/ Model — OEE Dashboard - Production Tracking - Excel Template
C2/ Model — OEE Dashboard - Production Tracking - Excel Template
Couldn't load pickup availability
Boost your production line's performance swiftly and conveniently with our comprehensive Excel document template, designed specifically for effective OEE (Overall Equipment Efficiency) calculation. This template empowers you to swiftly analyze and elevate the performance of your production line and machinery parks.
For a deeper understanding of OEE and its significance, feel free to check out our article: [All About Overall Equipment Efficiency (OEE)]
📊Explore the template's key features:
- Real-Time Dashboards:
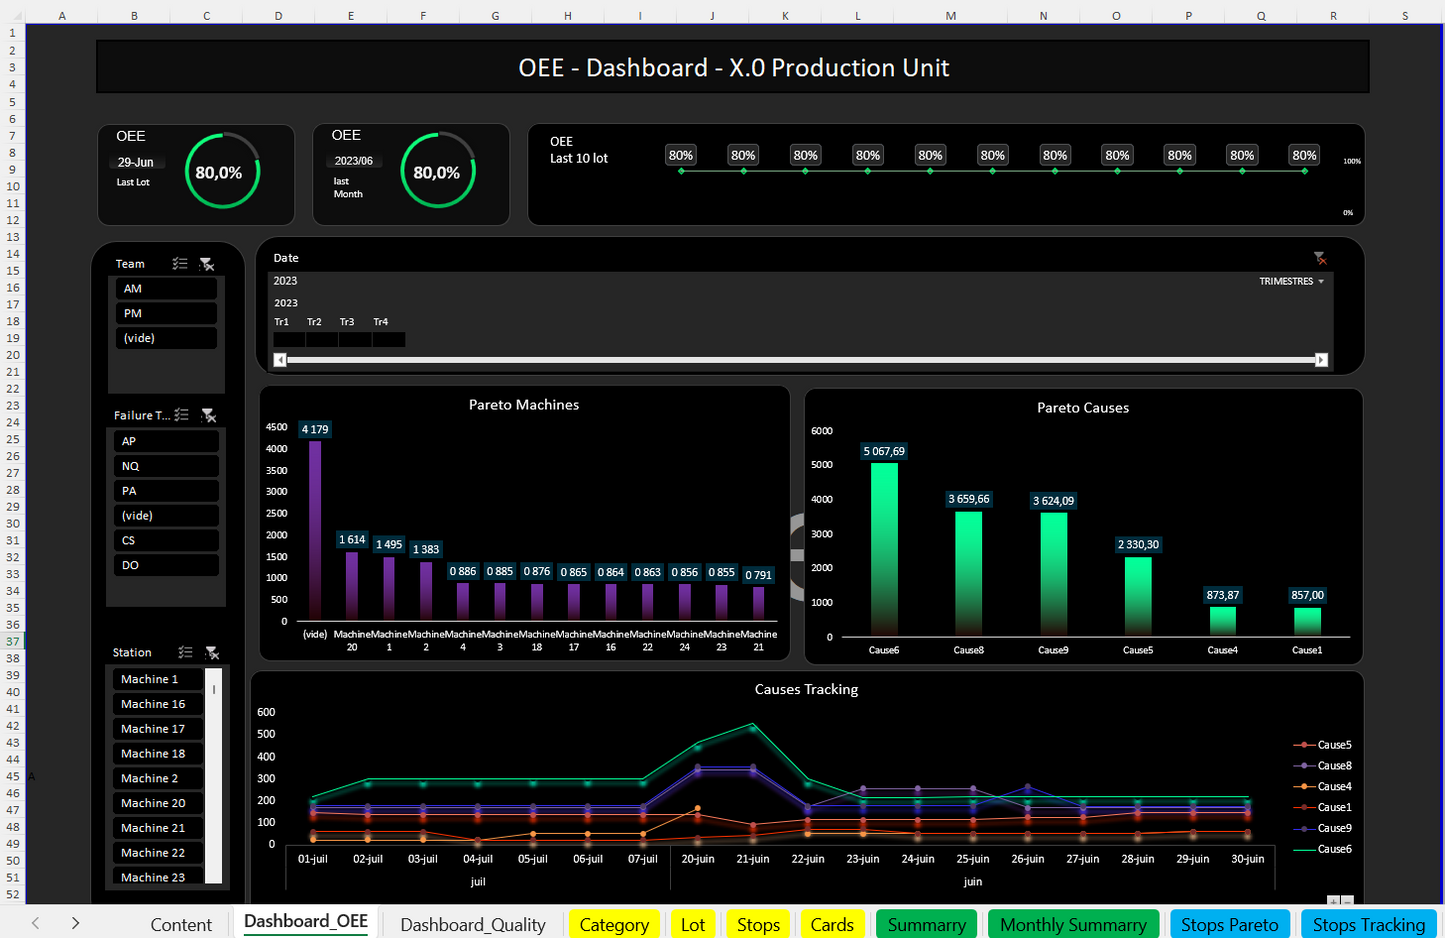
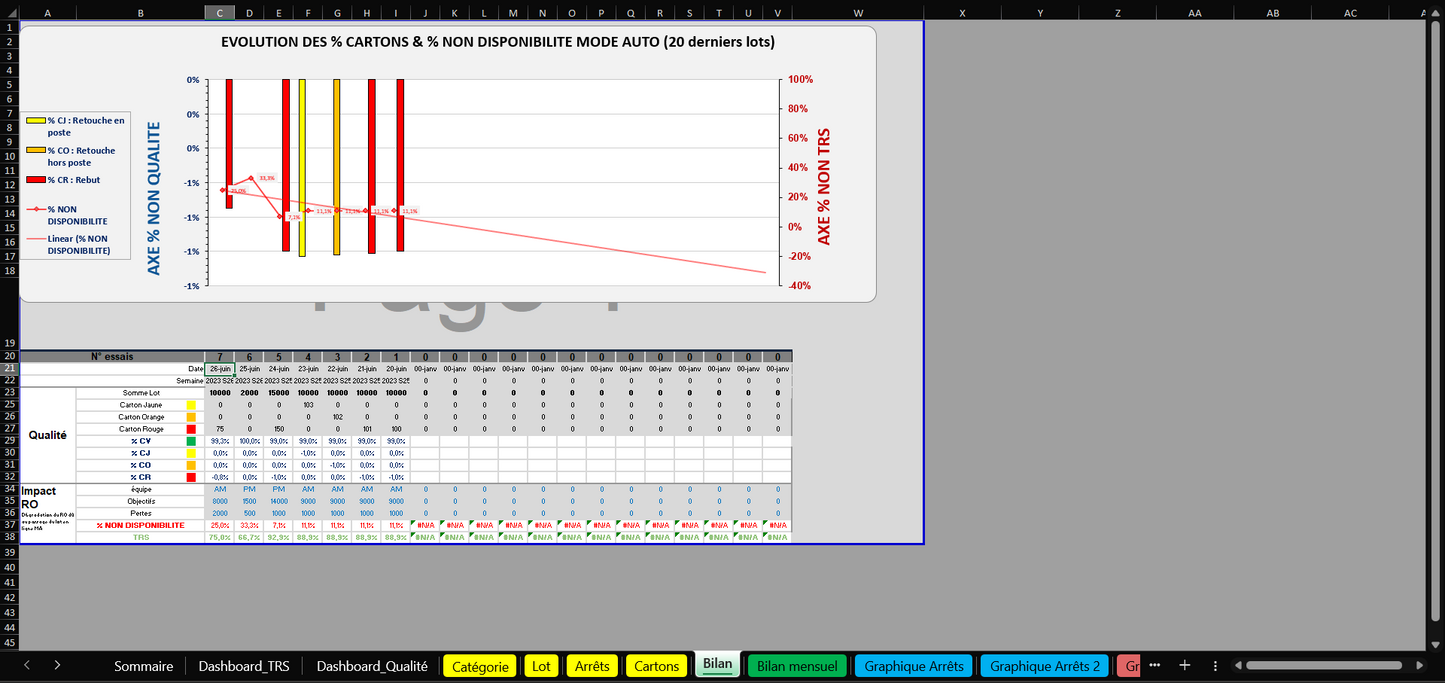
- Manufacturing OEE Dashboard: Enables real-time tracking of your Overall Equipment Efficiency (OEE calculation)
- Quality Dashboard: Facilitates immediate tracking of production quality
- Data Input Worksheets:
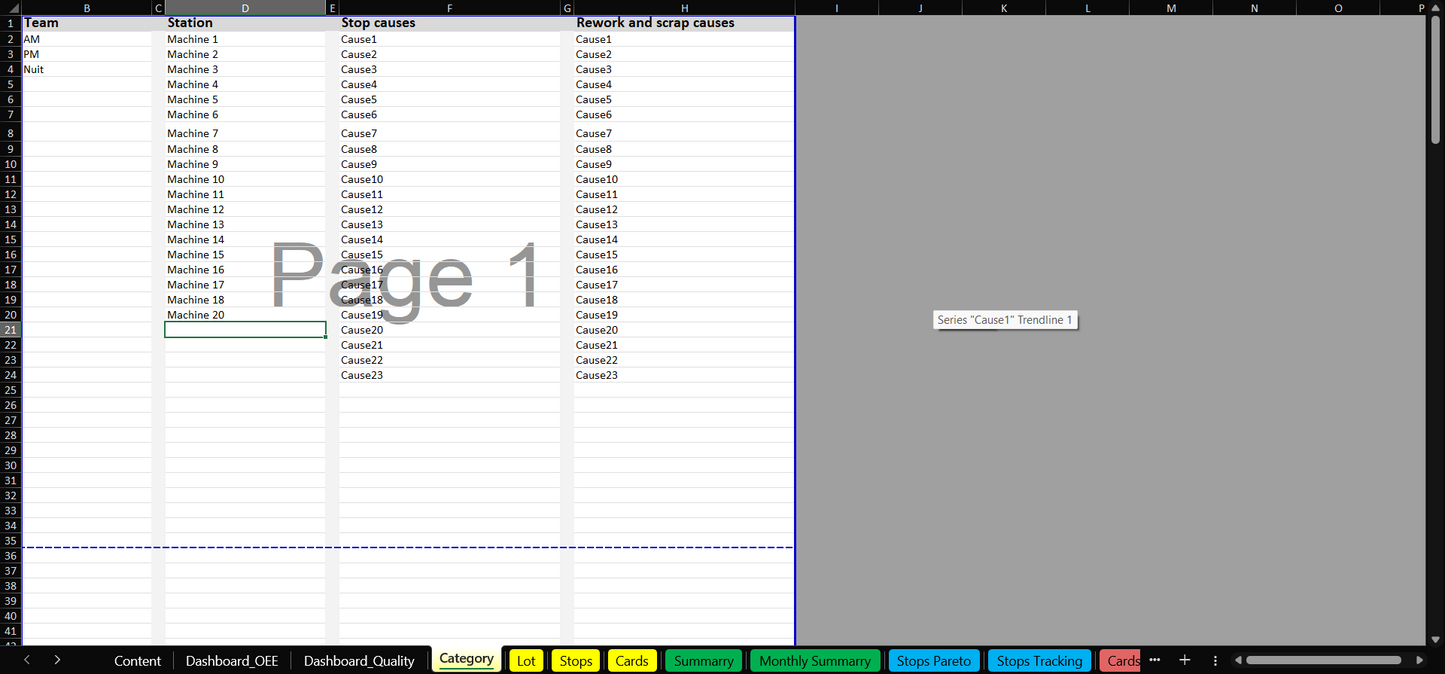
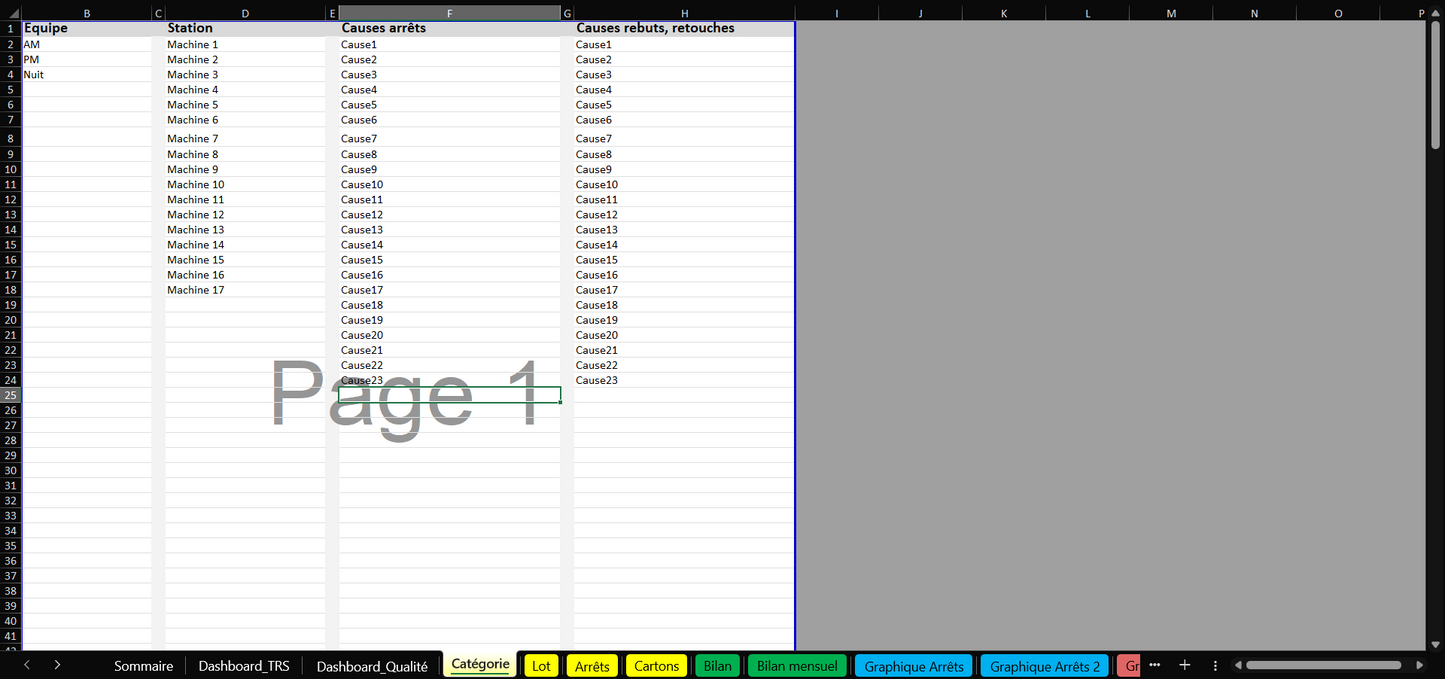
- Category: Register your teams, stations, and causes
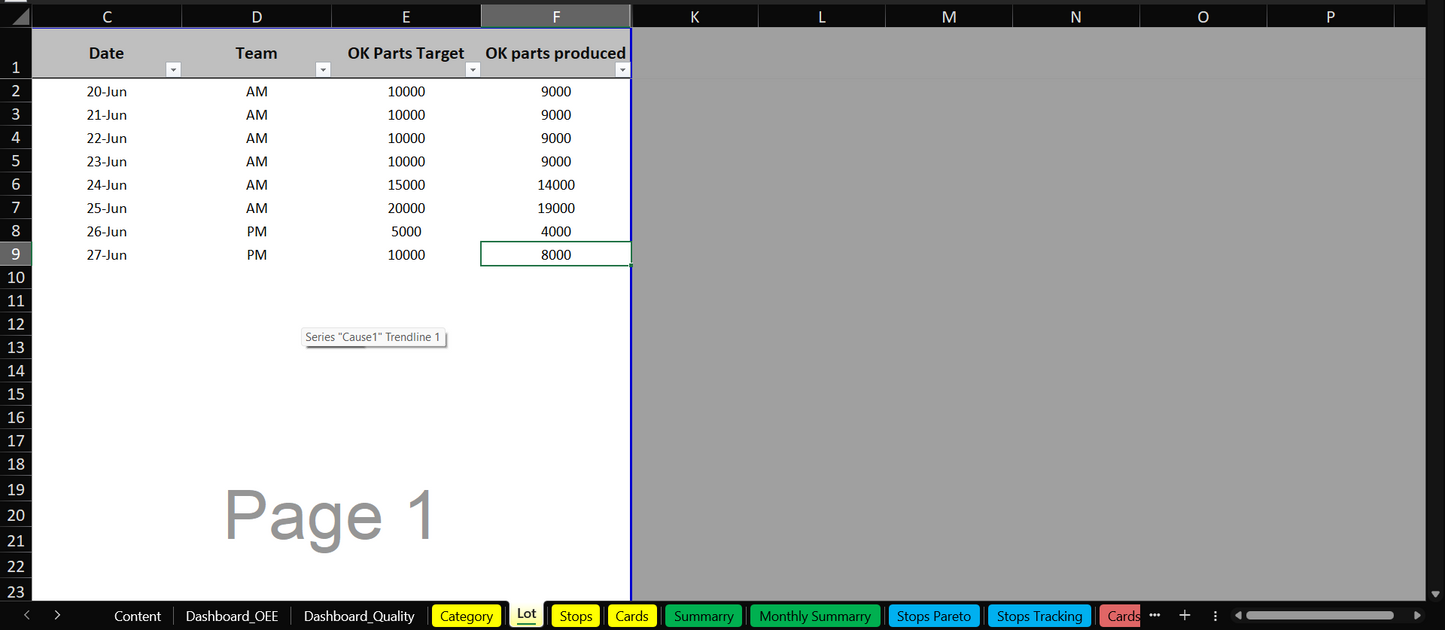
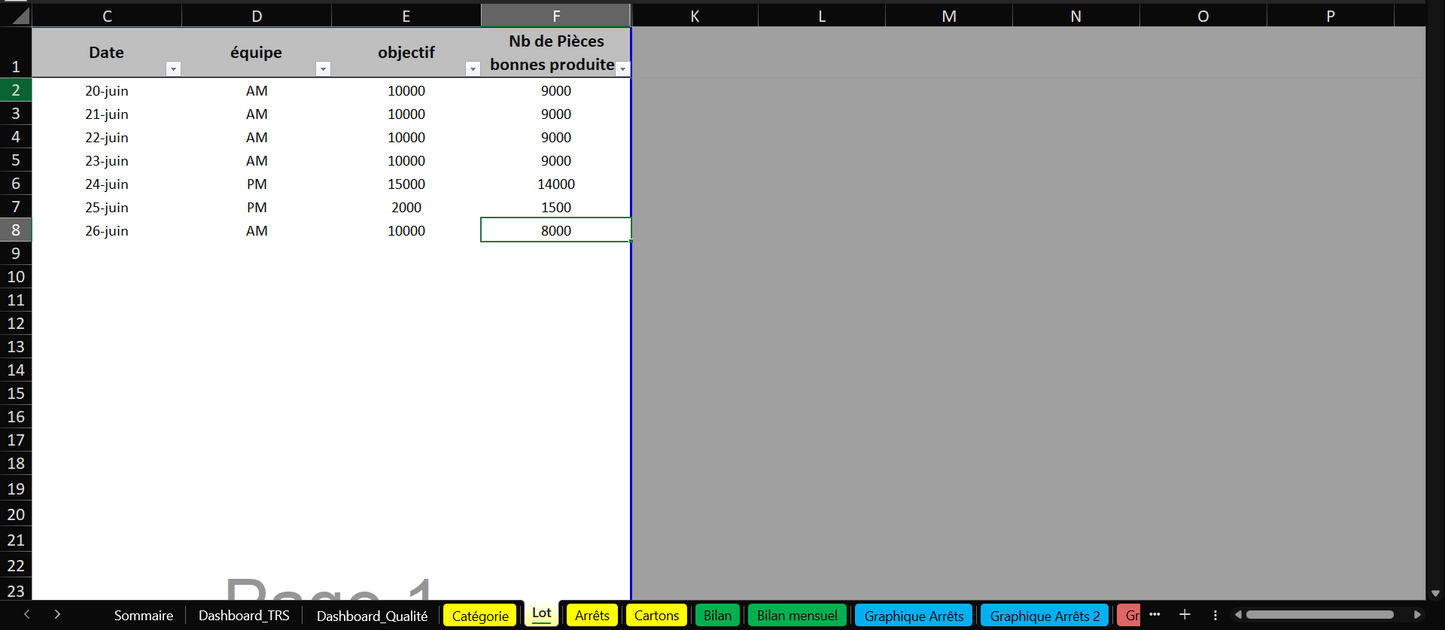
- Batch: Document daily production campaigns
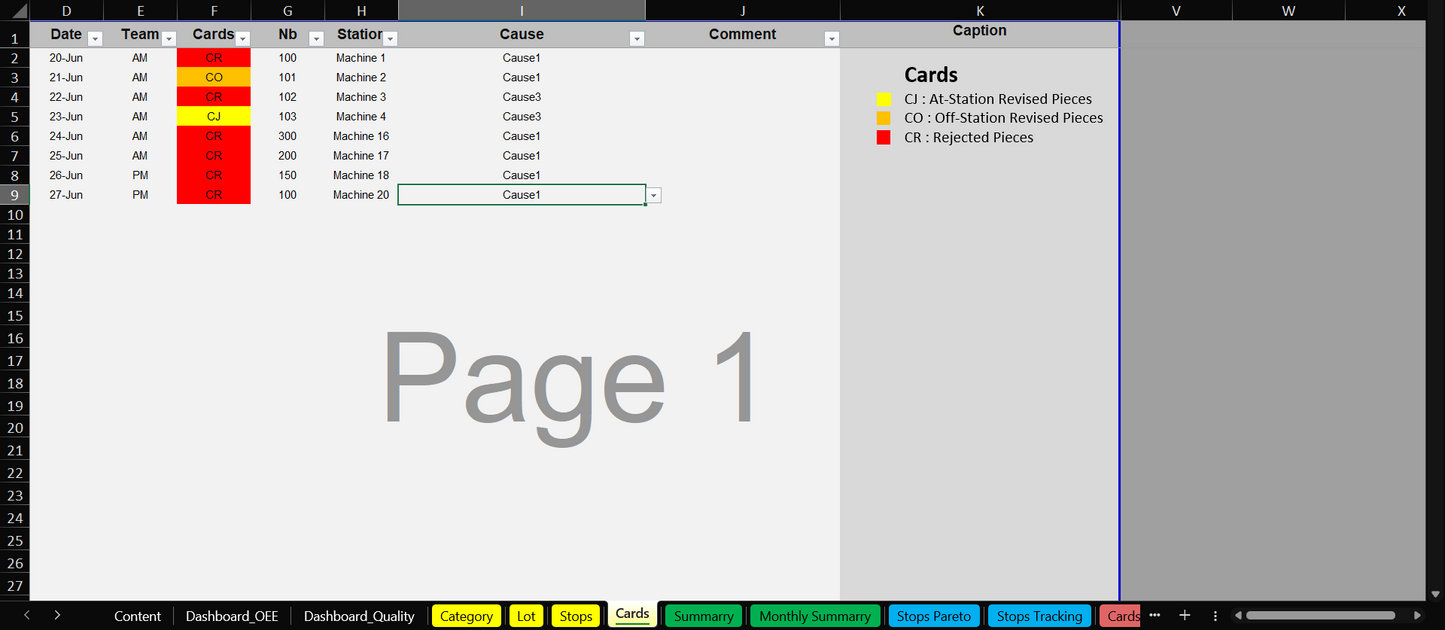
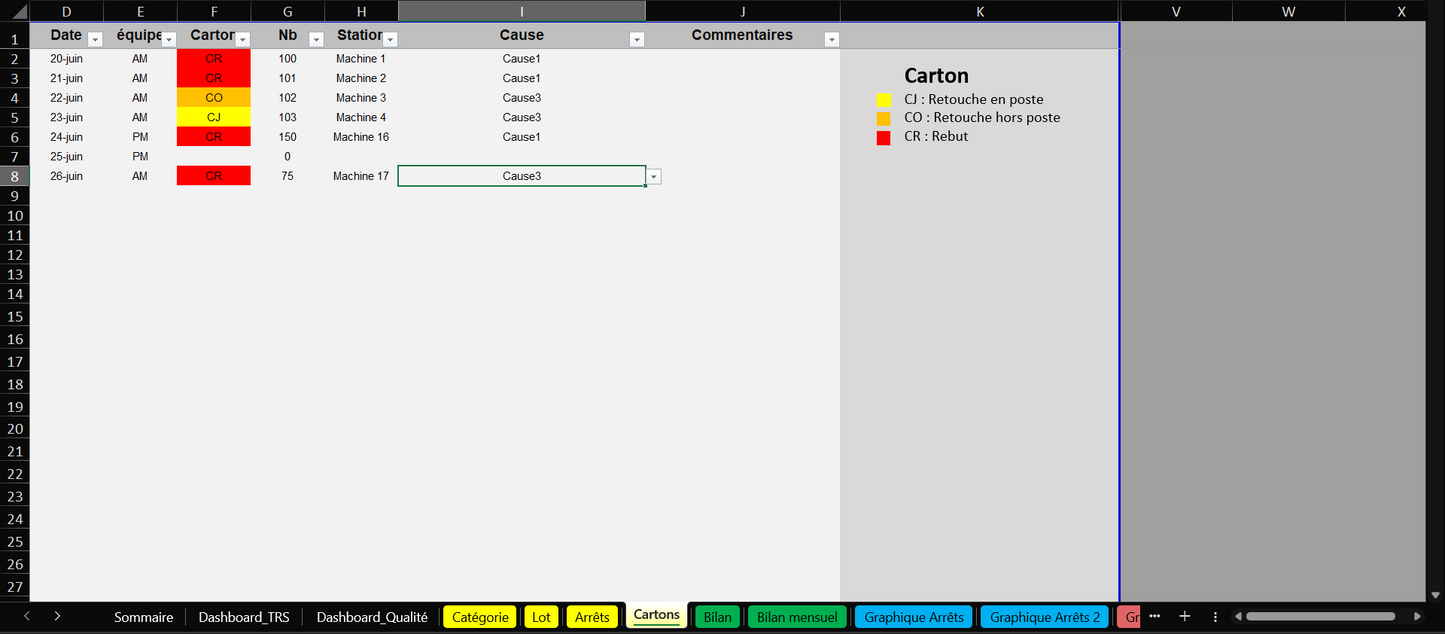
- Cards: Record the quantities of acceptable, retouched, and rejected parts
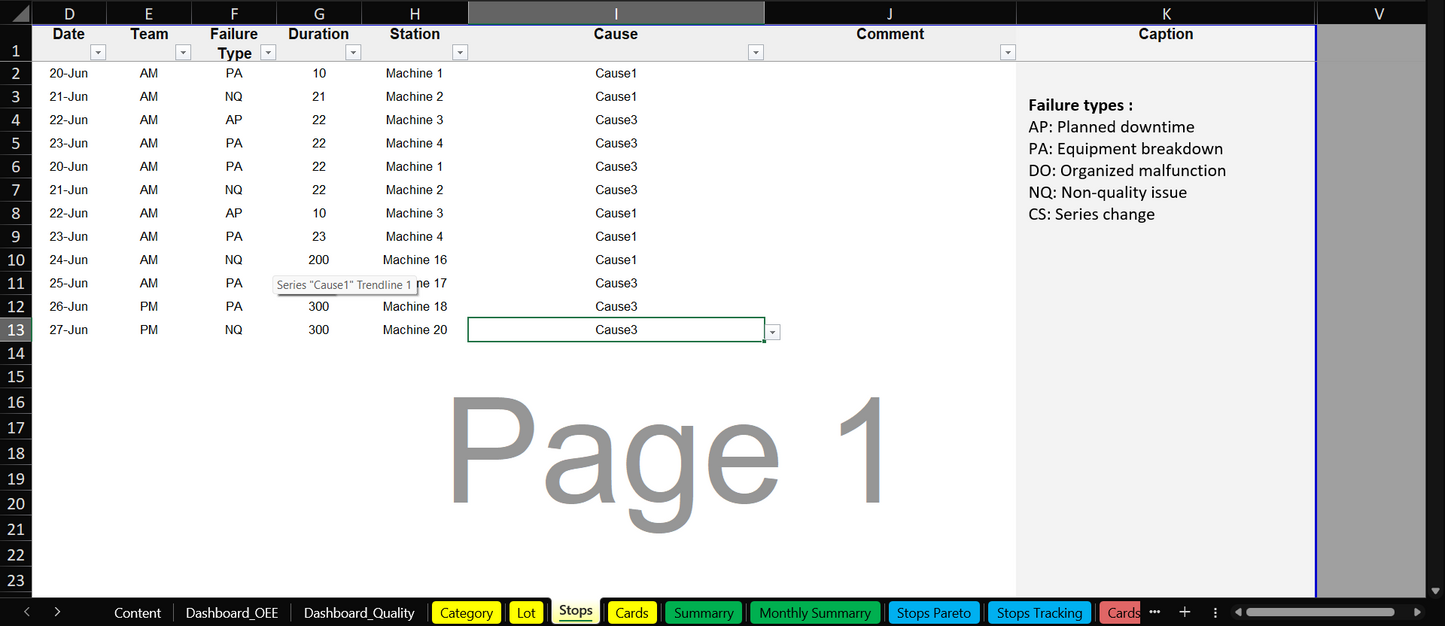
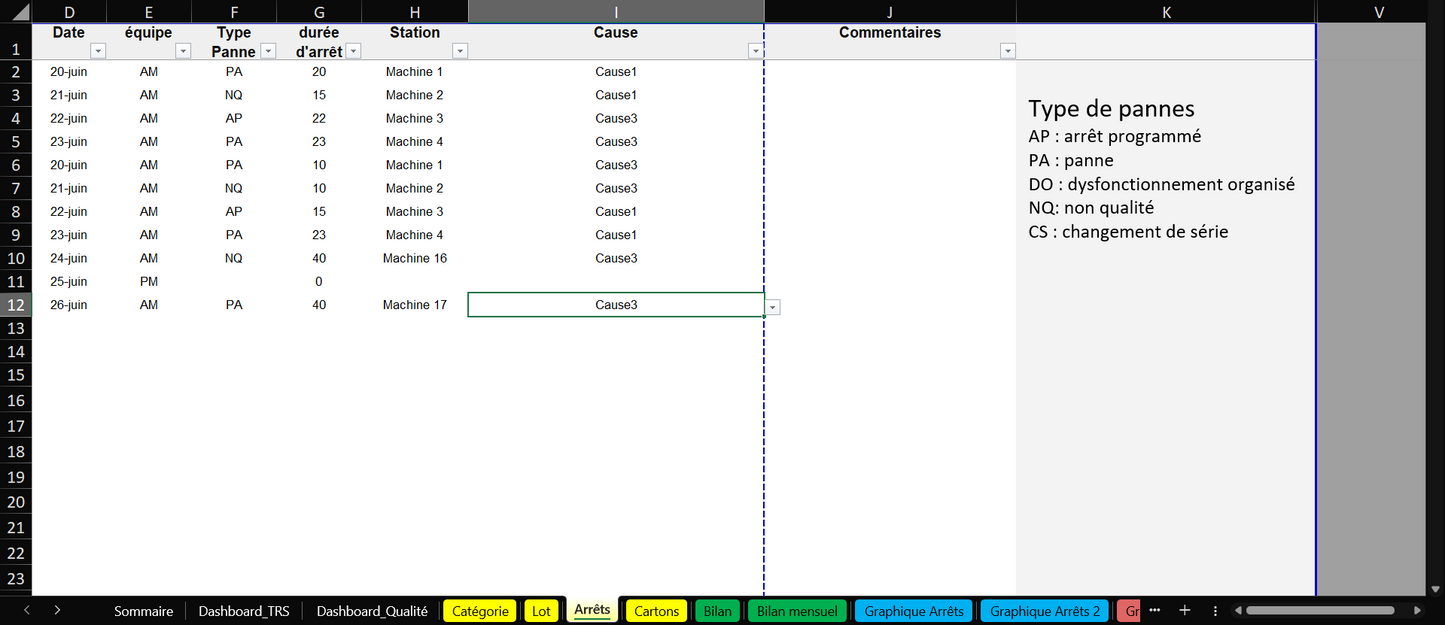
- Stops: Keep track of production interruptions
- Performance Graphs:
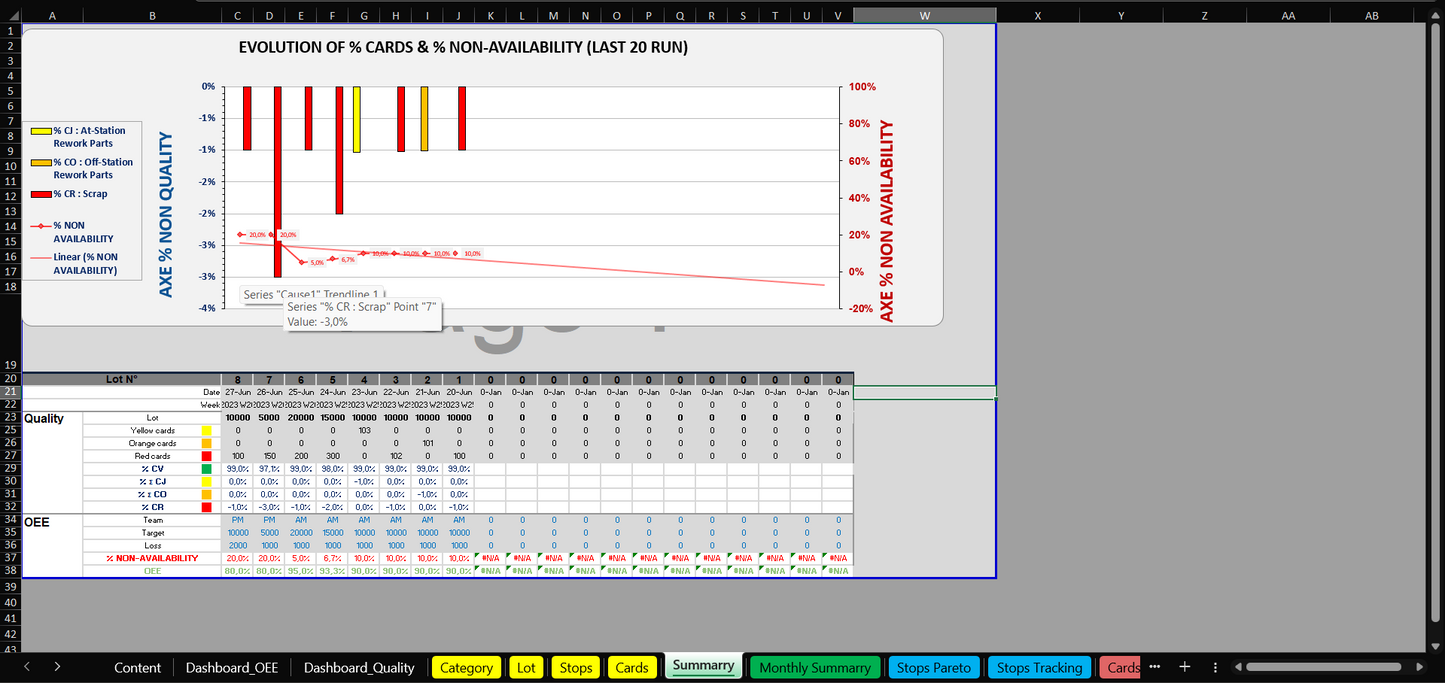
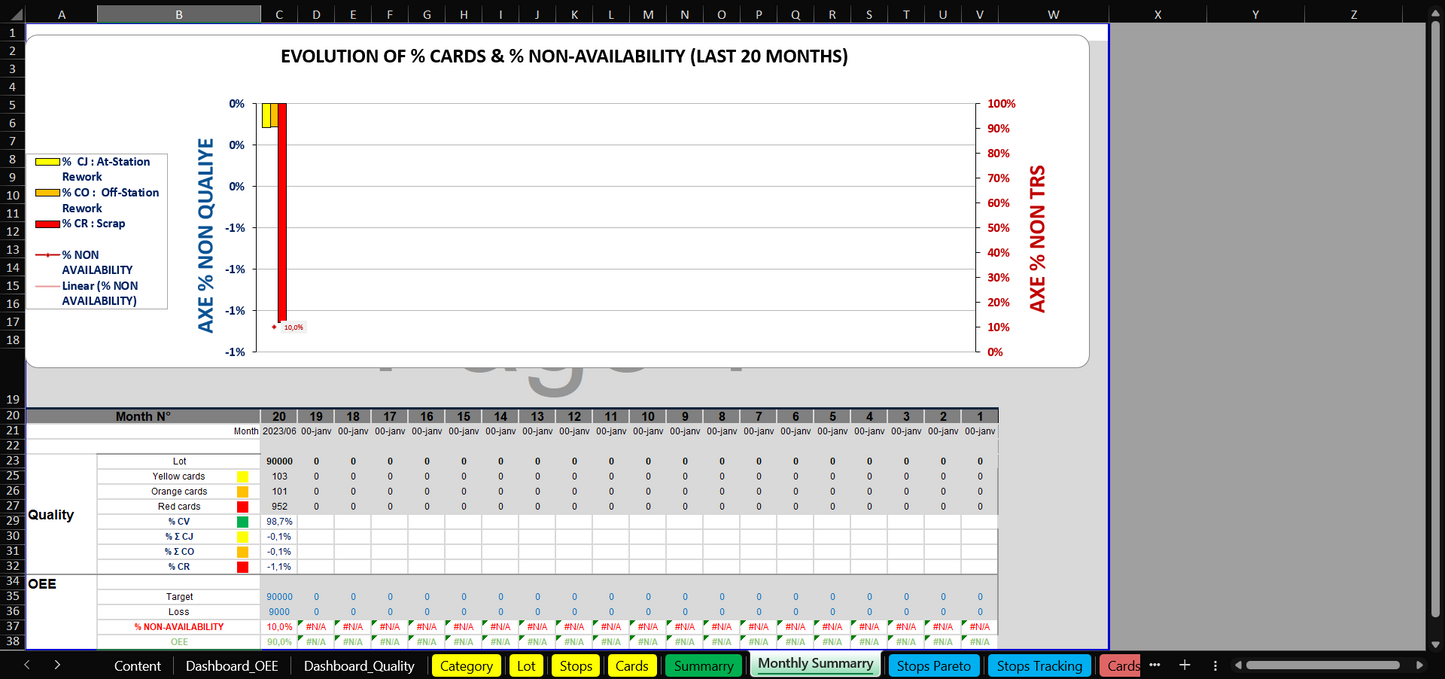
- Production Performance: Provides visual representation of your production performance trend
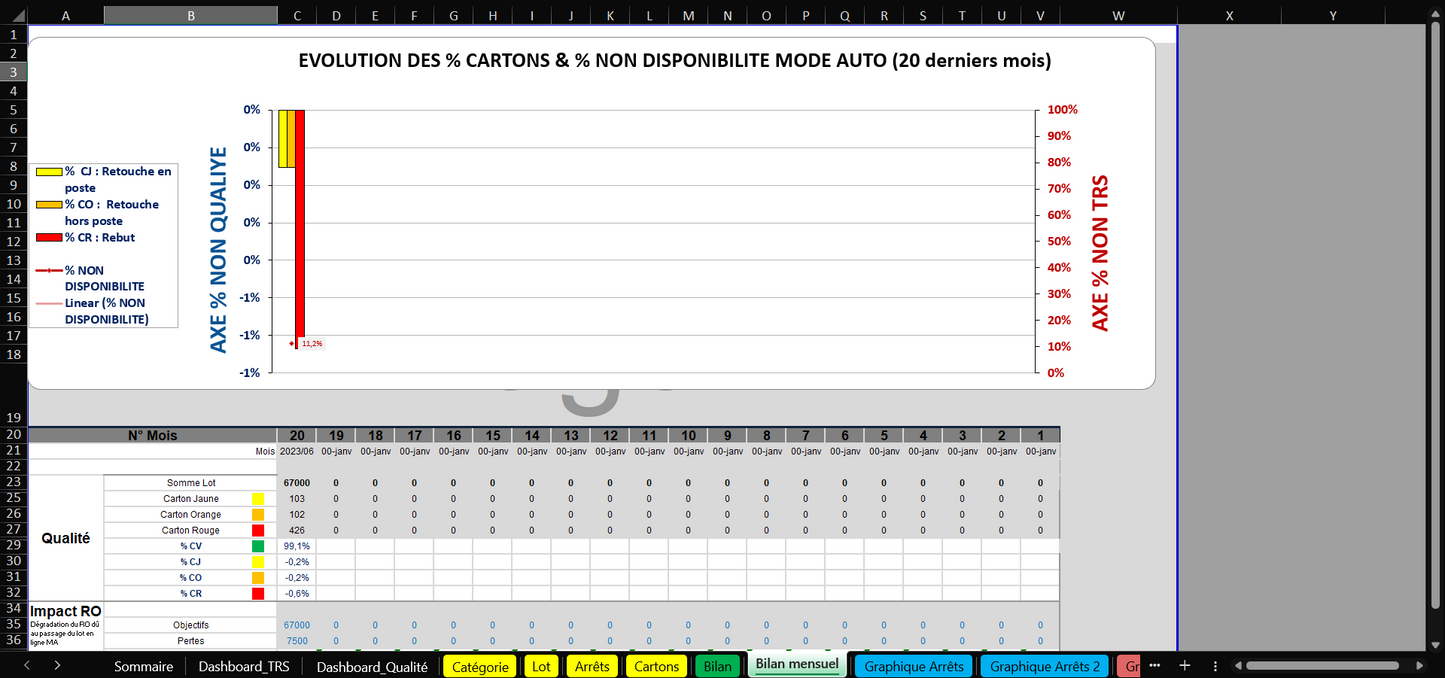
- Monthly Overview: Analyzes longer-term production trends via monthly run tracking
- Pareto Charts:
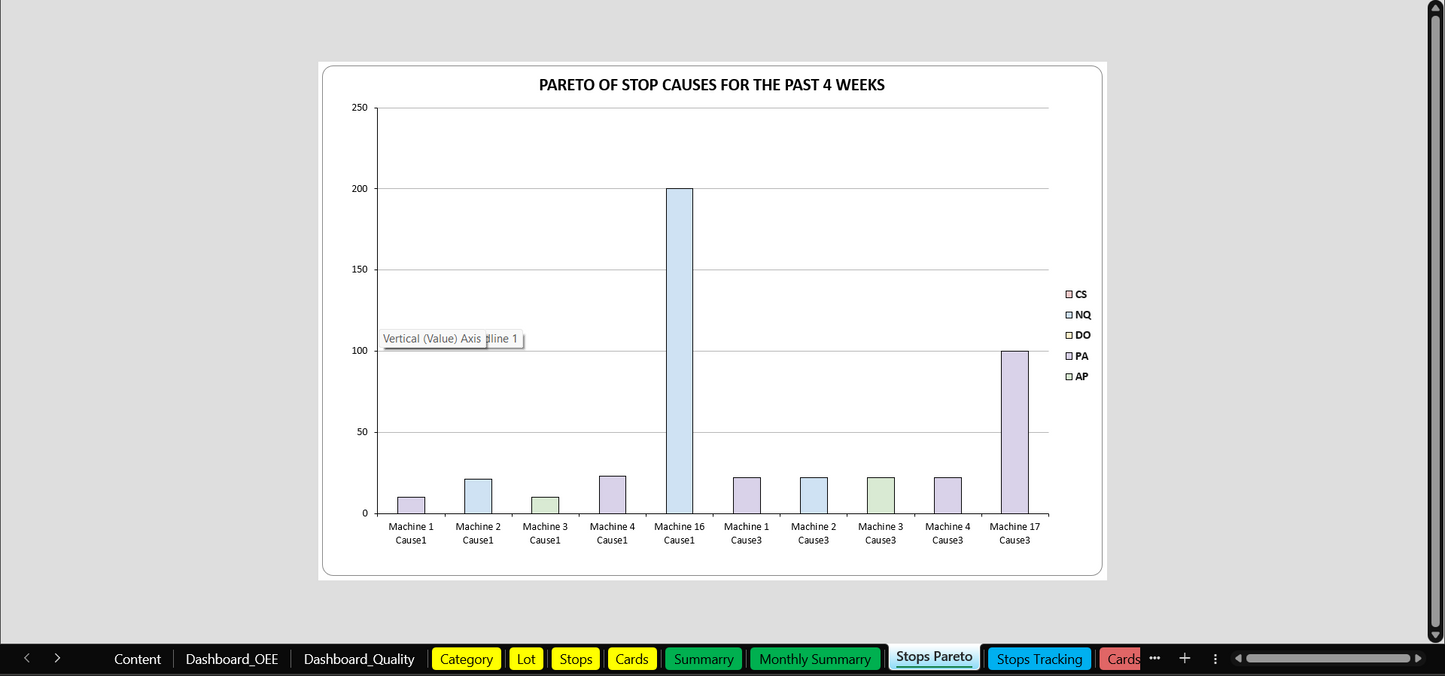
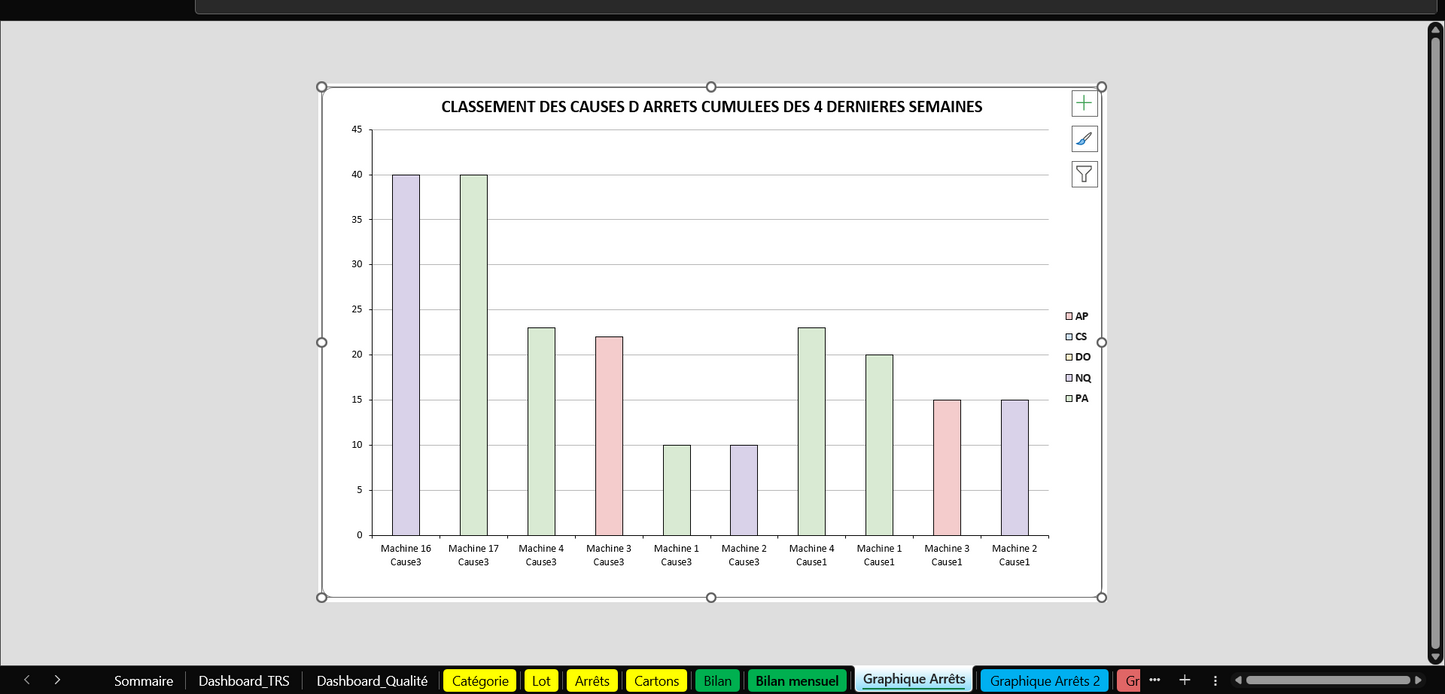
- Stoppage Chart: Showcases a Pareto analysis of production interruptions
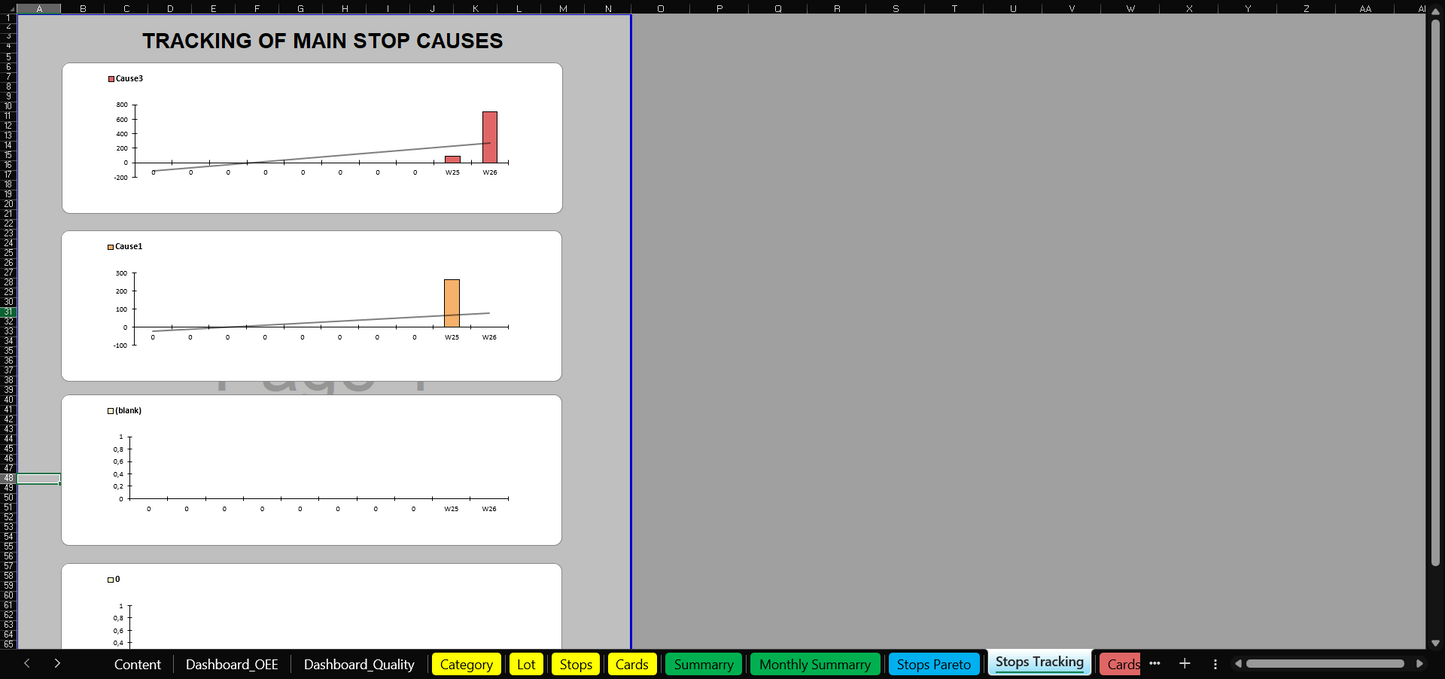
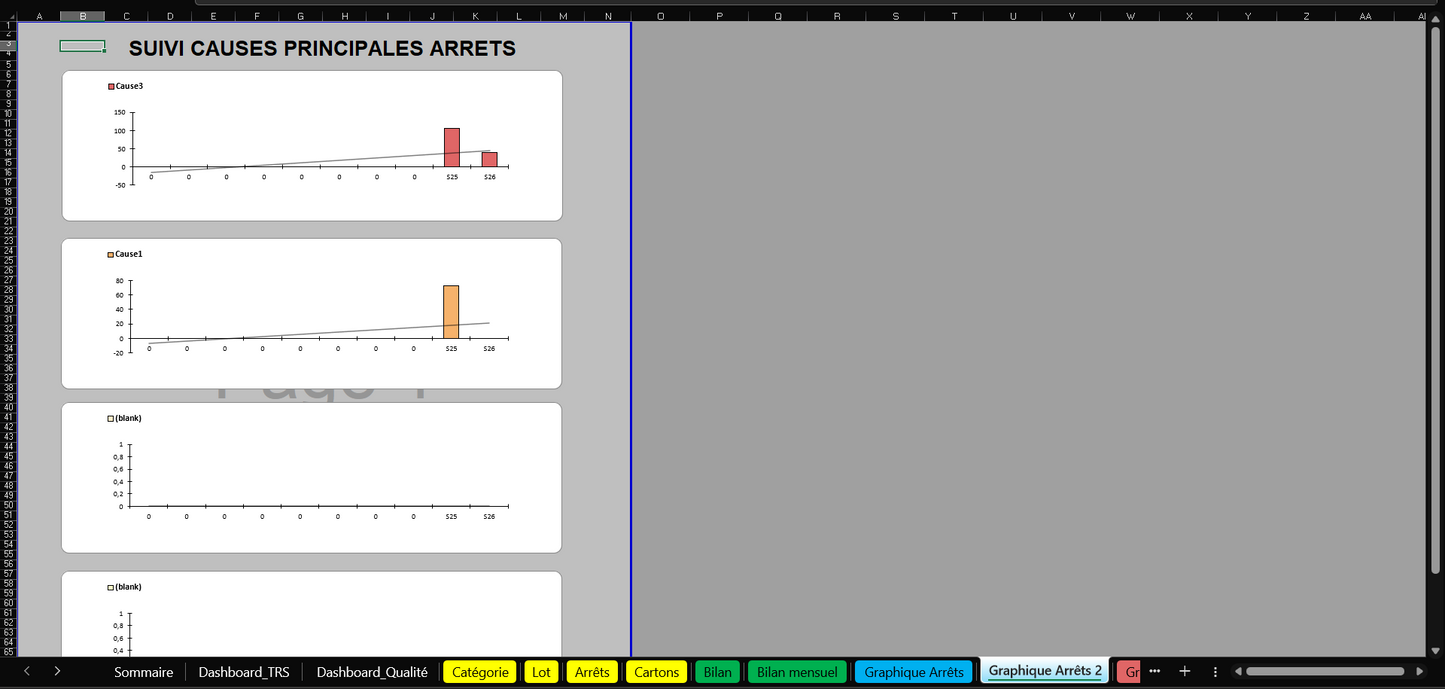
- Detailed Stoppage Chart: Provides a temporal perspective on major stoppages
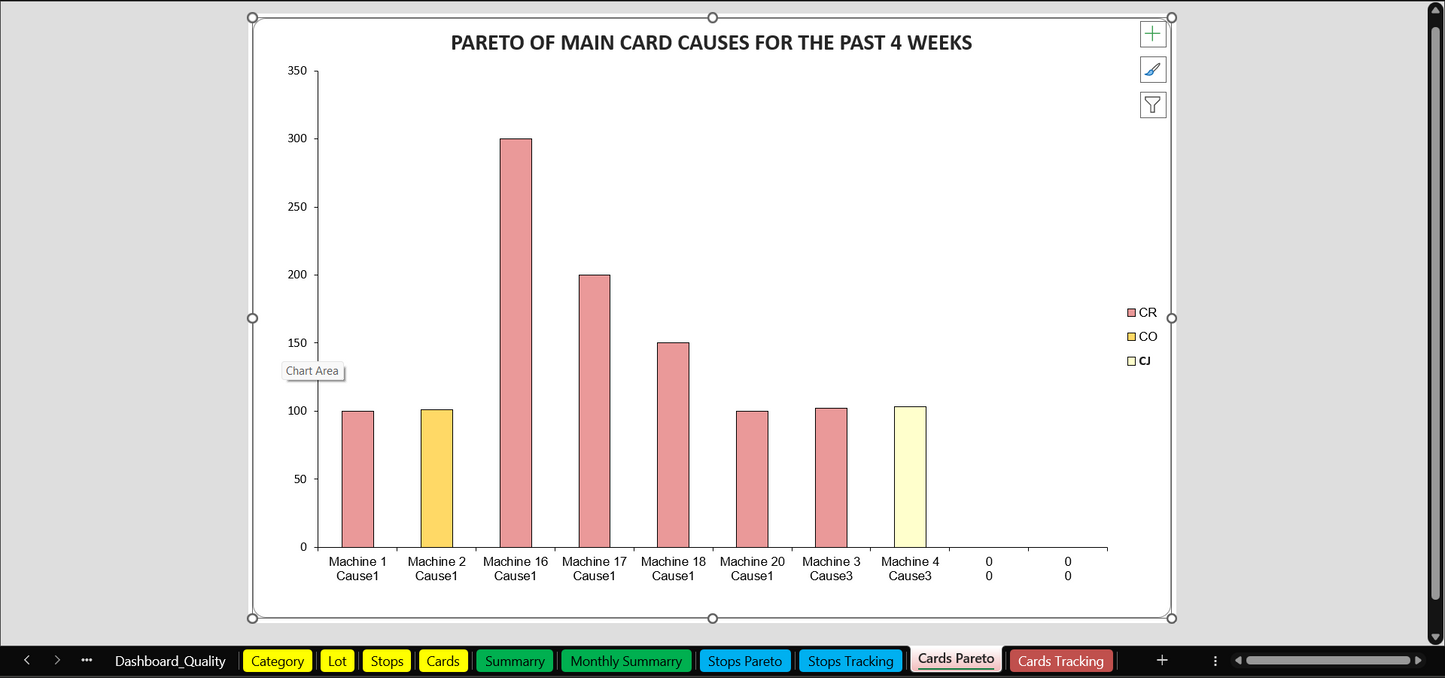
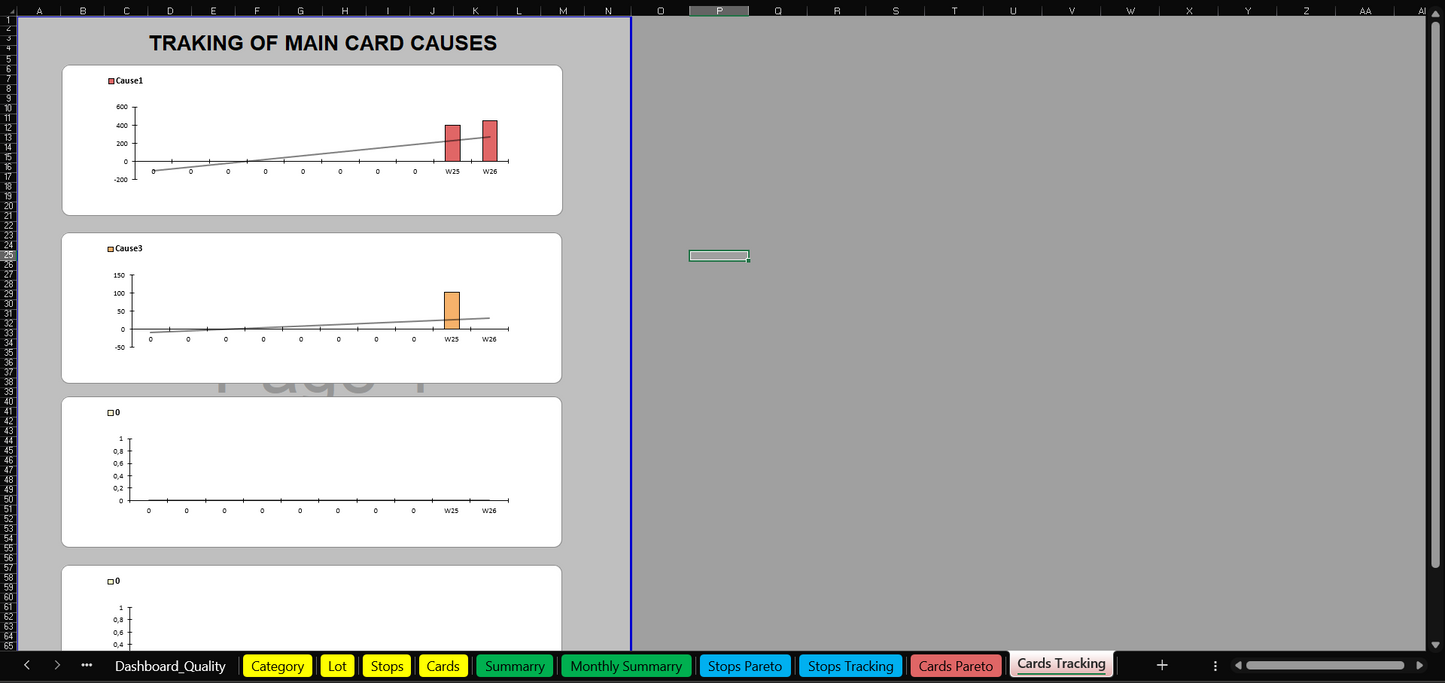
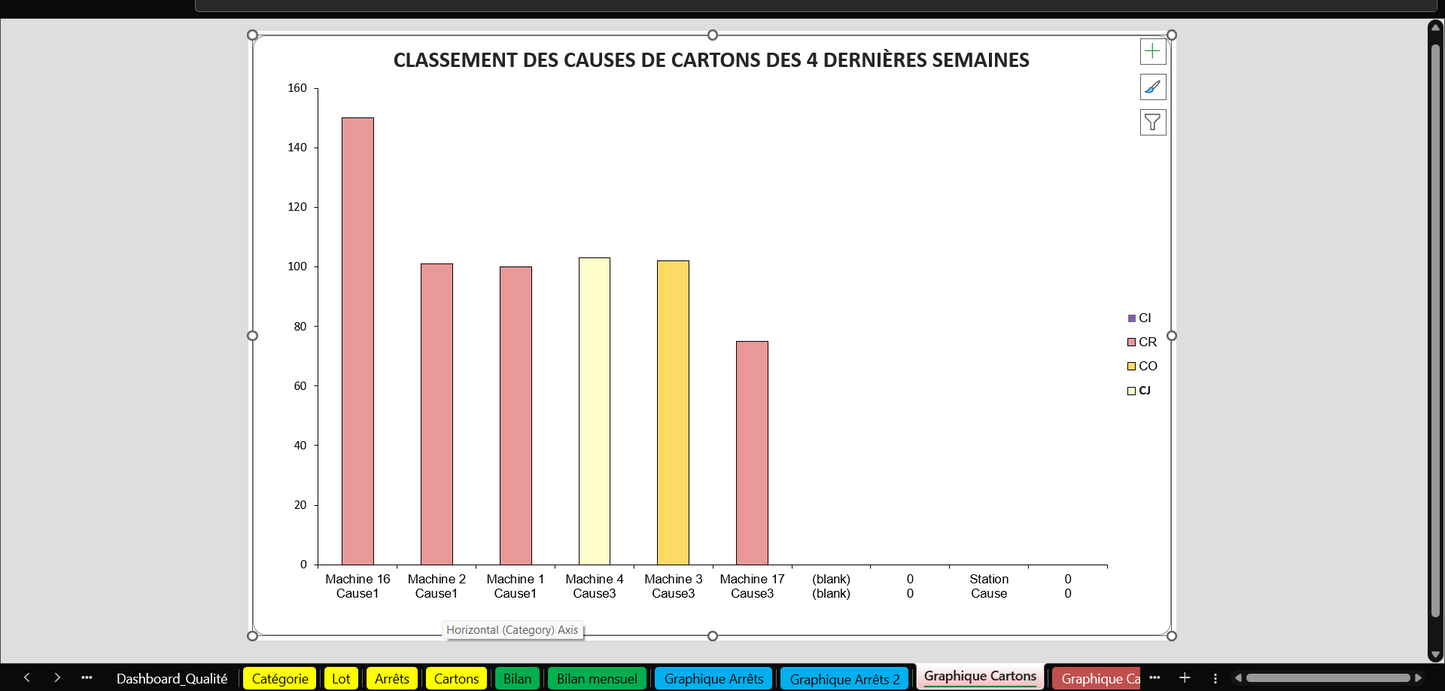
- Cards Analysis: Displays a Pareto chart of significant scraps and retouches
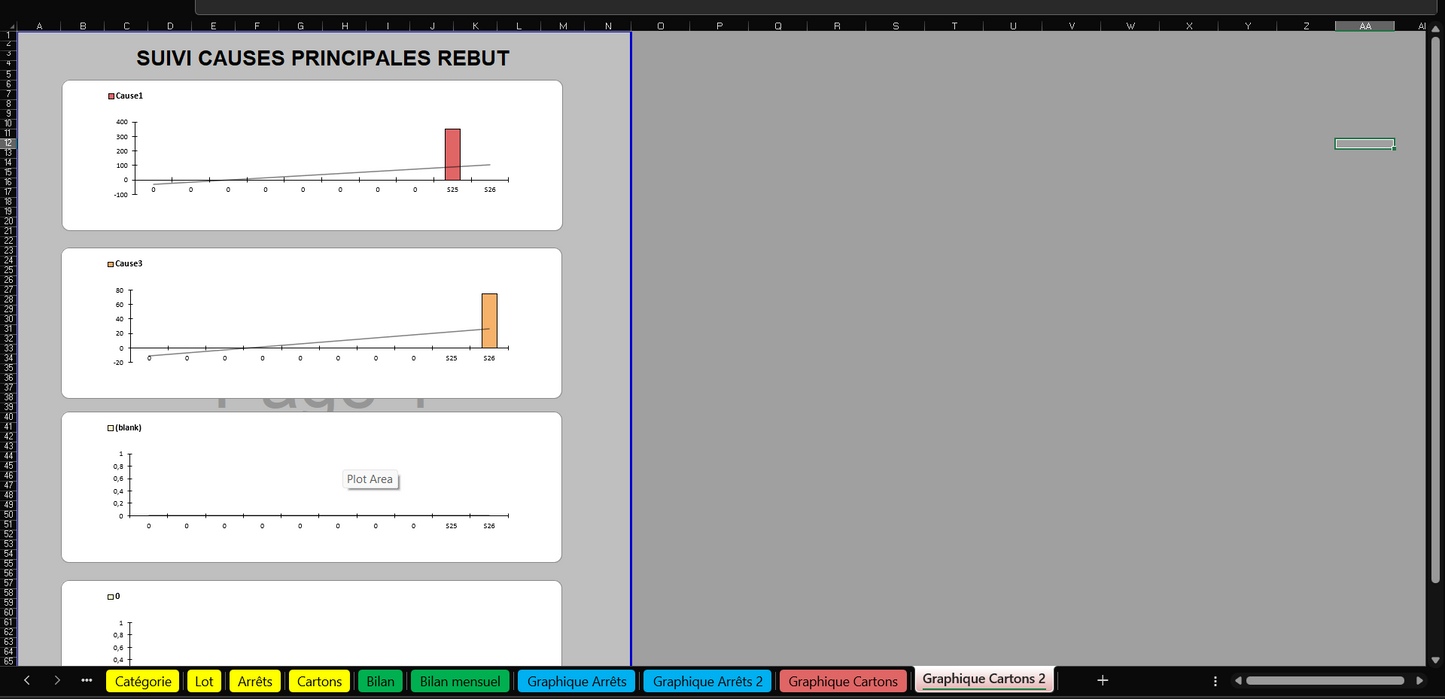
- Scrap Chart: Offers temporal tracking of major scraps
- Additional Tools:
- Custom Analyses: Dynamic pivot tables for tailored data examination
❓Step-by-step Guide:
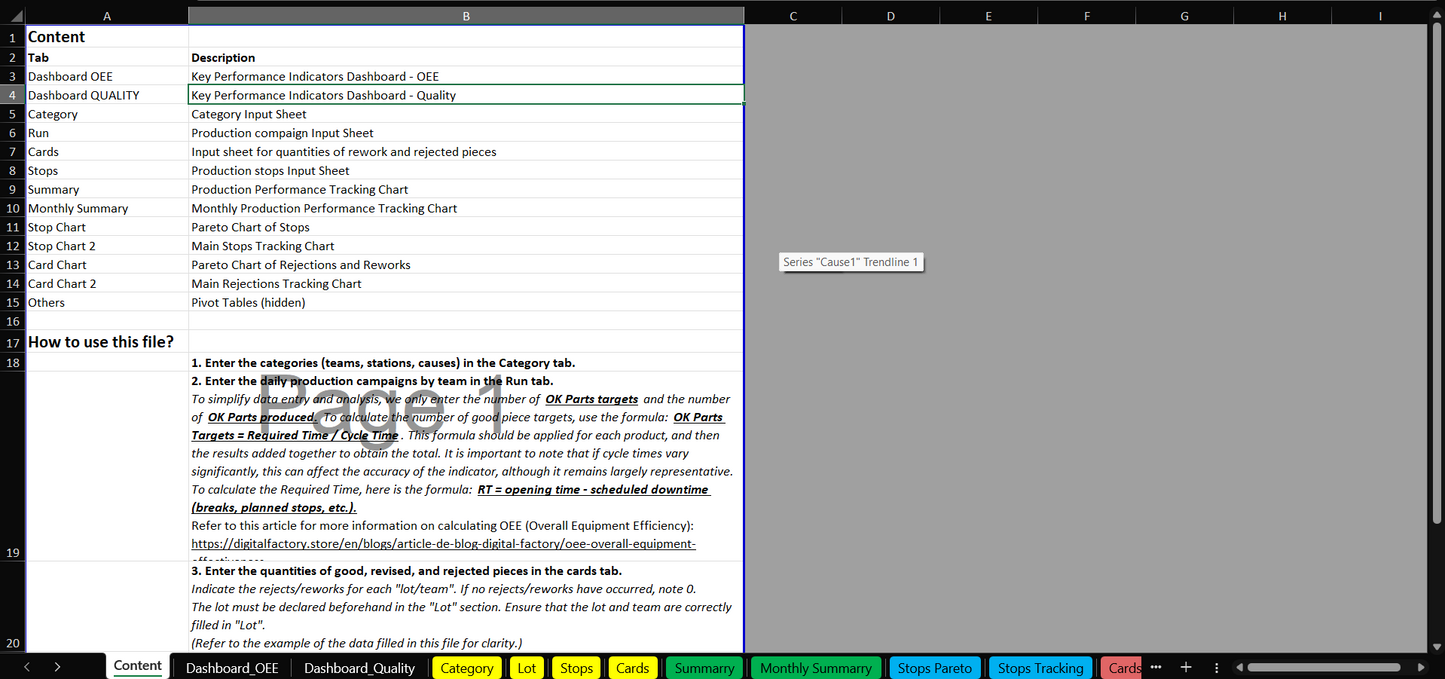
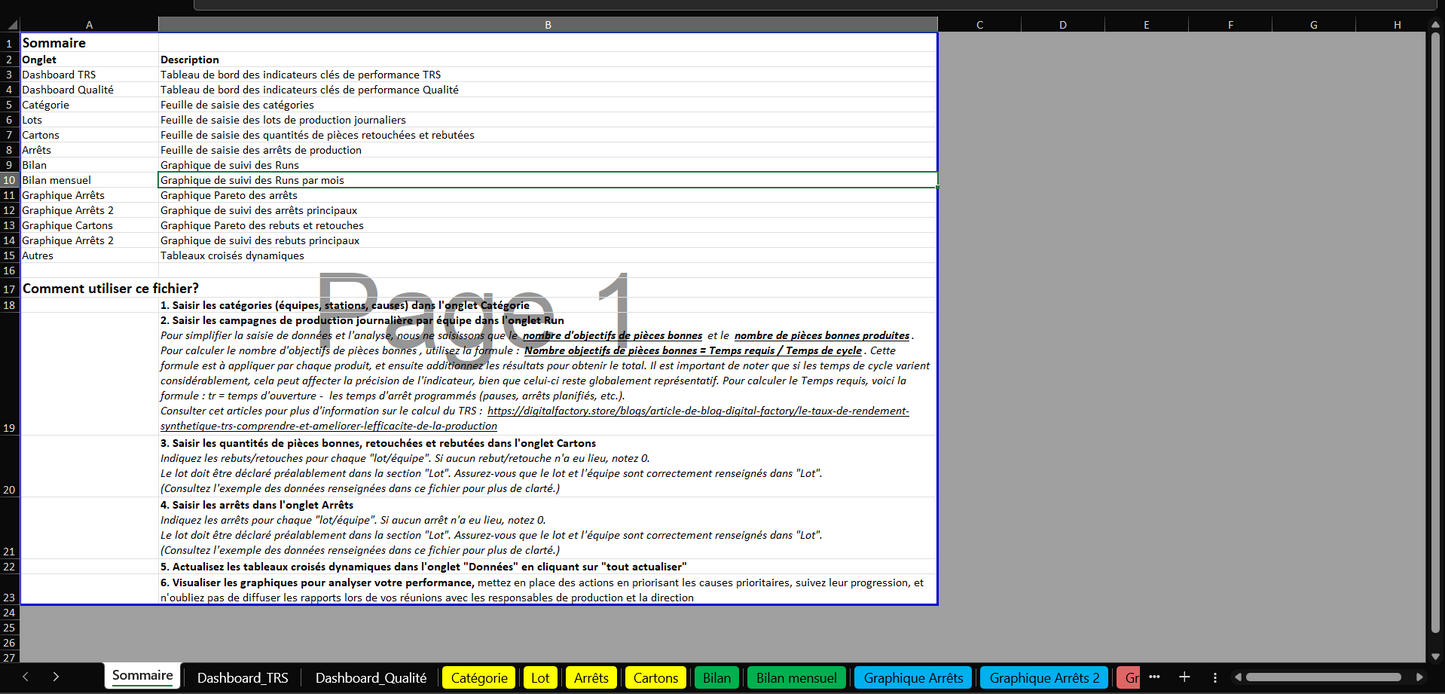
- Input categories (teams, stations, causes) in the 'Category' tab
- Document daily production campaigns per team in the 'Lot' tab
- Register quantities of acceptable, retouched, and rejected parts in the 'Cards' tab
- Note production stoppages and their causes in the 'Stops' tab
- Utilize the graphical insights to evaluate and bolster your production performance
🎯 Use this tool to deploy TPM (Total Productive Maintenance) in a simple, fast, and efficient manner. It's a resource used by leaders in the automotive industry, indispensable in today's competitive industrial context. Save time and resources and focus on improving your performance.
The document is compatible with Excel and will be promptly delivered to you post-purchase for immediate implementation.
For optimal monitoring, we provide step-by-step support in implementing a comprehensive solution to integrate data from your existing ERP, MES, SCADA systems, etc. This approach streamlines data entry for operators and enhances KPI analysis for managers, making it easier to evaluate improvement measures. To learn more about our support offerings, please visit our support services page and explore the features of our OEE software.
|
💡 Easy to use Immediate deployment |
⏱️ Instant delivery After ordering |
📞 Support Quick assistance as needed |
Key Features
- Production follow-up
- Quality report
- OEE tracking
- TPM deployment
- Pareto
- Real-time tracking
Compatibility
- Microsoft Excel
Share
- Access your product in 30 seconds: steps 👇
- Title
- Title

FAQs
How can I customize this document template to meet the specific needs of my business?
Our document templates are designed to be easily customizable to meet the specific needs of each business. You can adjust the fields, formats, and calculations according to your requirements. If you need advanced customization, our support team is available to assist you in modifying and optimizing the template to perfectly fit your work environment.
I don't like chart colors, hopefully, they are customizable. Also,there is no format protection, you should ensure correct cell formats, particularly for dates, to prevent issues on graphs
Sa facilité d'utilisation et son interface intuitive ont permis une adoption rapide par l'équipe. La saisie des données se fait via excel web depuis plusieurs postes opérateurs en même temps, c'est très pratique.
Merci pour votre commentaire !
très utile pour analyser la performance de production et implémenter des améliorations.
le mode opératoire est bien détaillé dans le premier onglet
Nous sommes heureux de voir que notre produit répond à vos attentes.
Subscription offers
Subscription - Access to Excel, Power BI and Ms project tutorials and models
Corporate Pack
- No renewal constraints
- Full access to all tutorials:
- MS Project: Planning, Resources
- Power BI: Data Preparation, Dashboards
- Power Automate: Workflow Automation
- Full access to all models:
- Project management, Operational efficiency, Lean,...
- Premium Dashboards Included
- Unlimited downloads
- Personal space included
- 30 minute support included
Monthly Subscription
- Full access to all tutorials:
- MS Project: Planning, Resources
- Power BI: Data Preparation, Dashboards
- Power Automate: Workflow Automation
- Full access to all models:
- Project management, Operational efficiency, Lean,...
- Premium Dashboards Included
- Unlimited downloads
- Personal space included
- 30 minute support included
Annual Subscription
- All the advantages of the monthly
- Save 36% compared to monthly
- Priority consultation with an expert
- Updates and new models every week
Recommendations
-
J8/ Model — Calculation and monitoring of OEE Excel 2025 ...
4.94 / 5.0
(32) 32 total reviews
Regular price From €159,00Regular priceUnit price / per€279,00Sale price From €159,00Sale -
J9/ Budget and Deliverables Tracking Template for Business
3.67 / 5.0
(6) 6 total reviews
Regular price From €59,00Regular priceUnit price / per€249,00Sale price From €59,00Sale -
J28/ Power Bi Project Management Template to download
4.0 / 5.0
(8) 8 total reviews
Regular price From €0,00Regular priceUnit price / per -
J27/ MS Project Gantt Planning Template to download
Regular price From €69,00Regular priceUnit price / per -
J10/ Project Management Excel Model for project managers
4.82 / 5.0
(11) 11 total reviews
Regular price From €49,00Regular priceUnit price / per€219,00Sale price From €49,00Sale -
J30/ Power BI Model - Risk Analysis (Amdec)
Regular price From €0,00Regular priceUnit price / per -
J7/ Model — Example FMEA Excel Process - Dashboard - RPN ...
4.44 / 5.0
(9) 9 total reviews
Regular price From €59,00Regular priceUnit price / per -
C1/ ebook: White Paper - From vision to action, the futur...
5.0 / 5.0
(4) 4 total reviews
Regular price €39,00Regular priceUnit price / per -
A2/ Advanced OEE Excel Template - Powerful Manufacturing ...
4.87 / 5.0
(23) 23 total reviews
Regular price From €99,00Regular priceUnit price / per€99,00Sale price From €99,00 -
A1/ Template - Budget and project deliverables tracking -...
5.0 / 5.0
(3) 3 total reviews
Regular price From €29,00Regular priceUnit price / per€59,00Sale price From €29,00Sale -
A9/ Model - Project Risk Analysis - Google Sheet/Excel
2.0 / 5.0
(1) 1 total reviews
Regular price €39,00Regular priceUnit price / per€149,00Sale price €39,00Sale -
A3/ Model - Process FMEA - Google Sheet/Excel - Pro
4.0 / 5.0
(1) 1 total reviews
Regular price From €29,00Regular priceUnit price / per€59,00Sale price From €29,00Sale -
A5/ Model - Dasboard KPI Planning MS Project - Excel - Go...
Regular price From €49,00Regular priceUnit price / per -
A5/ Excel FMEA Template - Google Sheet/Excel - Basic
3.67 / 5.0
(3) 3 total reviews
Regular price €0,00Regular priceUnit price / per -
C2/ Model — OEE Dashboard - Production Tracking - Excel T...
4.0 / 5.0
(3) 3 total reviews
Regular price From €49,00Regular priceUnit price / per€99,00Sale price From €49,00Sale -
A6/ Template — Machine risk analysis — Google Sheet/Excel
Regular price €499,00Regular priceUnit price / per -
A8/ Model — Maintenance instructions - Example User Manua...
Regular price From €39,00Regular priceUnit price / per -
A4/ Model — Suppliers assessment — Google Sheet/Excel
5.0 / 5.0
(1) 1 total reviews
Regular price From €9,00Regular priceUnit price / per€29,00Sale price From €9,00Sale -
J6/ Model — Free Excel Production Monitoring File: Exampl...
3.0 / 5.0
(2) 2 total reviews
Regular price €0,00Regular priceUnit price / per -
J11/ PDF — TRS - Definition, calculation, benefits and im...
Regular price €0,00Regular priceUnit price / per -
J12/ PDF — Industry 5.0: Definition, technology, advantag...
Regular price €0,00Regular priceUnit price / per -
J13/ Maintenance Management Excel Model (CMMS)
5.0 / 5.0
(1) 1 total reviews
Regular price From €99,00Regular priceUnit price / per -
J29/ Power BI Model - TRS (Overall Earnings Ratio) Monito...
5.0 / 5.0
(1) 1 total reviews
Regular price From €0,00Regular priceUnit price / per -
J14/ 5S Excel Model: Checklist, Audit and Control for Ind...
Regular price €0,00Regular priceUnit price / per -
J15/ Advanced DMAIC Model for your Lean Six Sigma Project...
Regular price €0,00Regular priceUnit price / per
Any questions?

Contact form
blog posts
View all-

How to reduce the administrative costs of a com...
Introduction to Business Cost Reduction Reducing business costs is essential to maximizing profitability. Accounting, logistics, human resources: the tasks involved are essential, but also costly and time-consuming. However, it is...
How to reduce the administrative costs of a com...
Introduction to Business Cost Reduction Reducing business costs is essential to maximizing profitability. Accounting, logistics, human resources: the tasks involved are essential, but also costly and time-consuming. However, it is...
-

Improve your project management with the Kanban...
Introduction Businesses are facing unprecedented challenges when it comes to project management. Client expectations are rising, deadlines are shrinking, and project complexity is constantly increasing. Faced with these challenges, traditional...
Improve your project management with the Kanban...
Introduction Businesses are facing unprecedented challenges when it comes to project management. Client expectations are rising, deadlines are shrinking, and project complexity is constantly increasing. Faced with these challenges, traditional...
-

How to boost innovation?
Introduction Innovation is no longer a simple competitive advantage: in a context marked by the constant evolution of technologies and customer expectations, also with the acceleration towards industry 4.0 ,...
1 commentHow to boost innovation?
Introduction Innovation is no longer a simple competitive advantage: in a context marked by the constant evolution of technologies and customer expectations, also with the acceleration towards industry 4.0 ,...
1 comment


