Subscribe to our newsletter
Be the first to know about the latest solutions
Digital factory
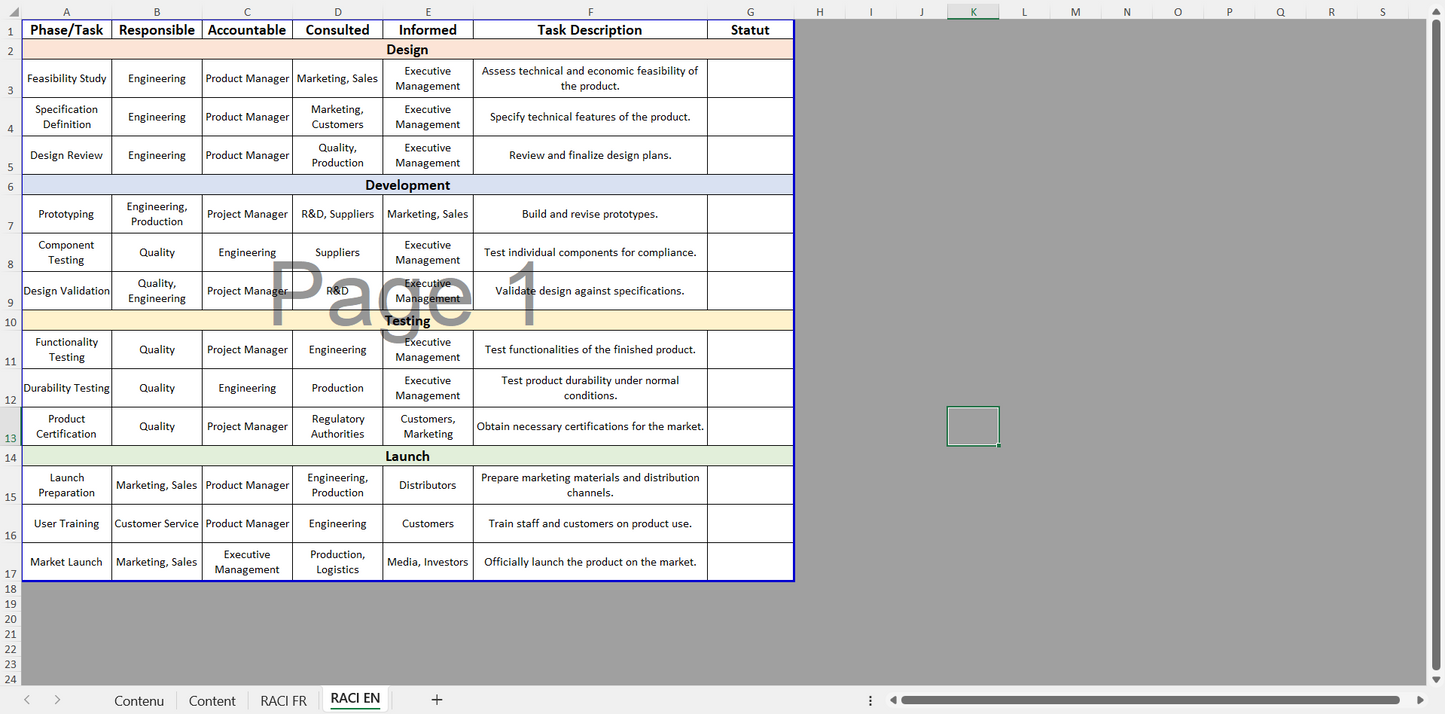
J24/ Example of RACI Matrix in Project Management with Excel Table
J24/ Example of RACI Matrix in Project Management with Excel Table
Couldn't load pickup availability
(Your order is free. No payment is required.)
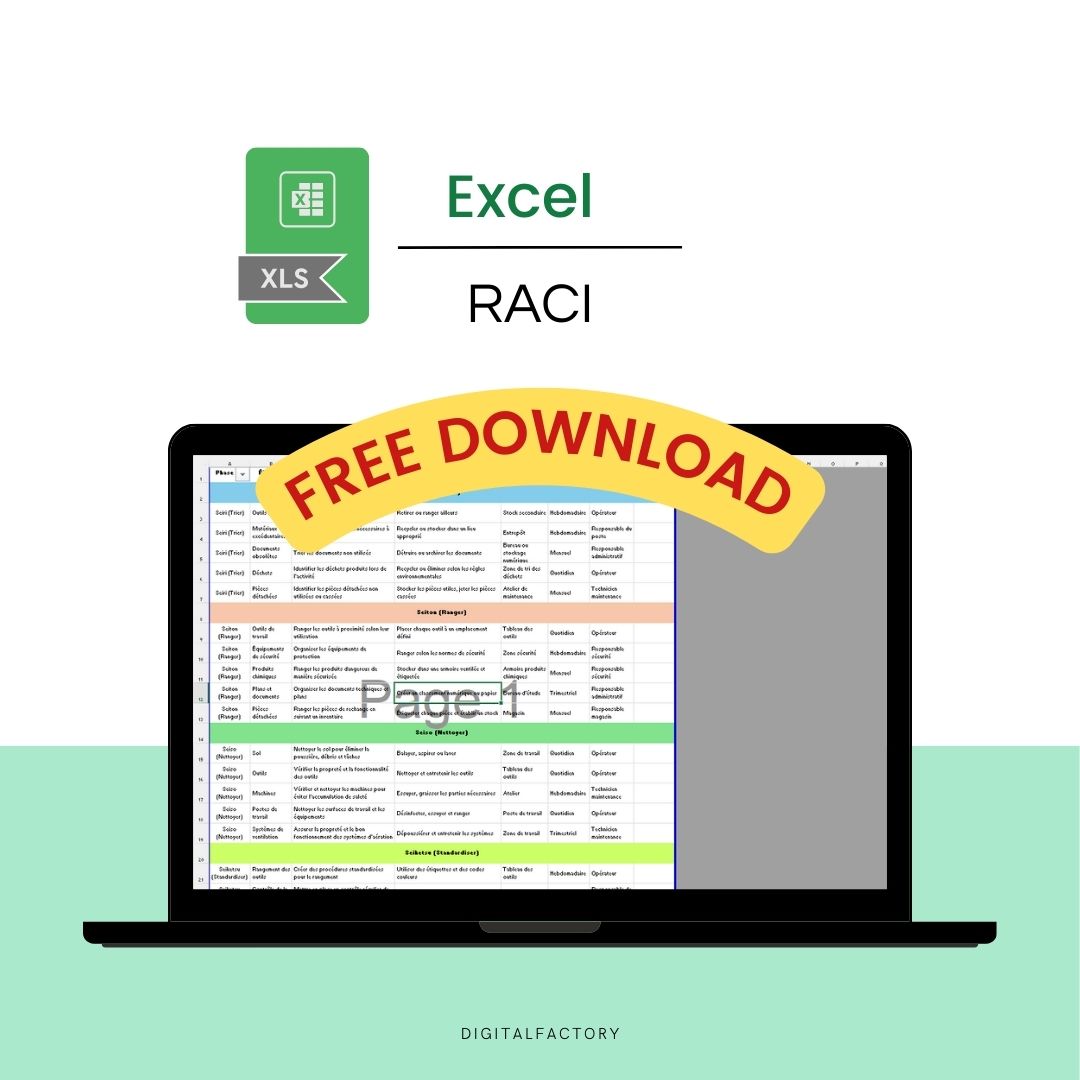
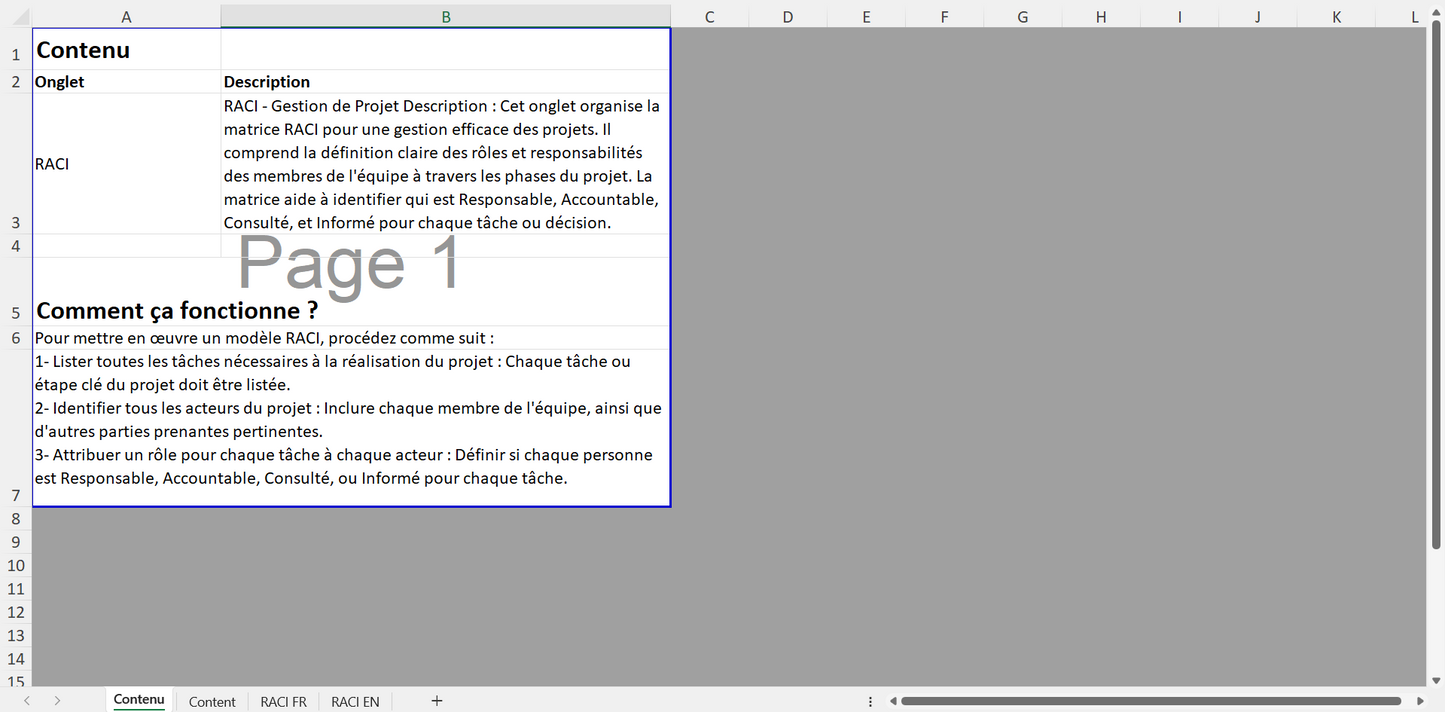
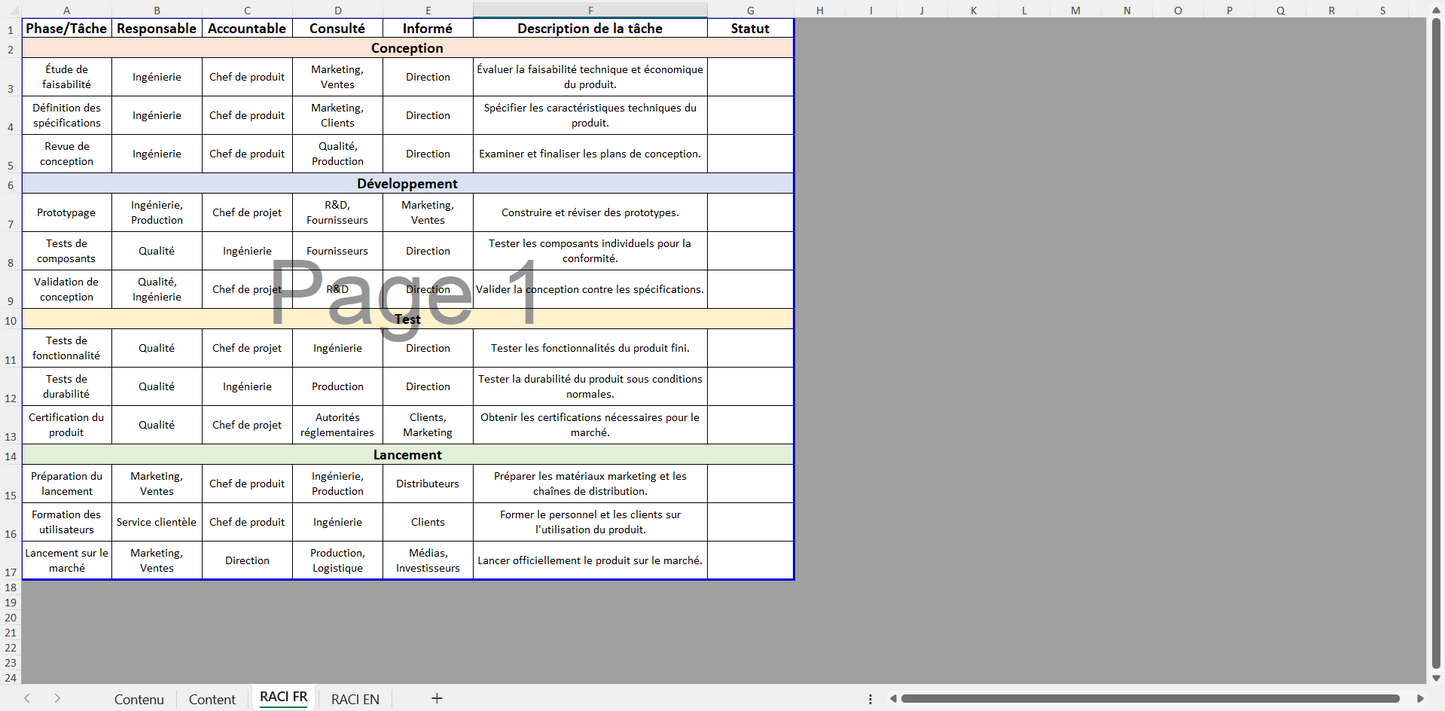
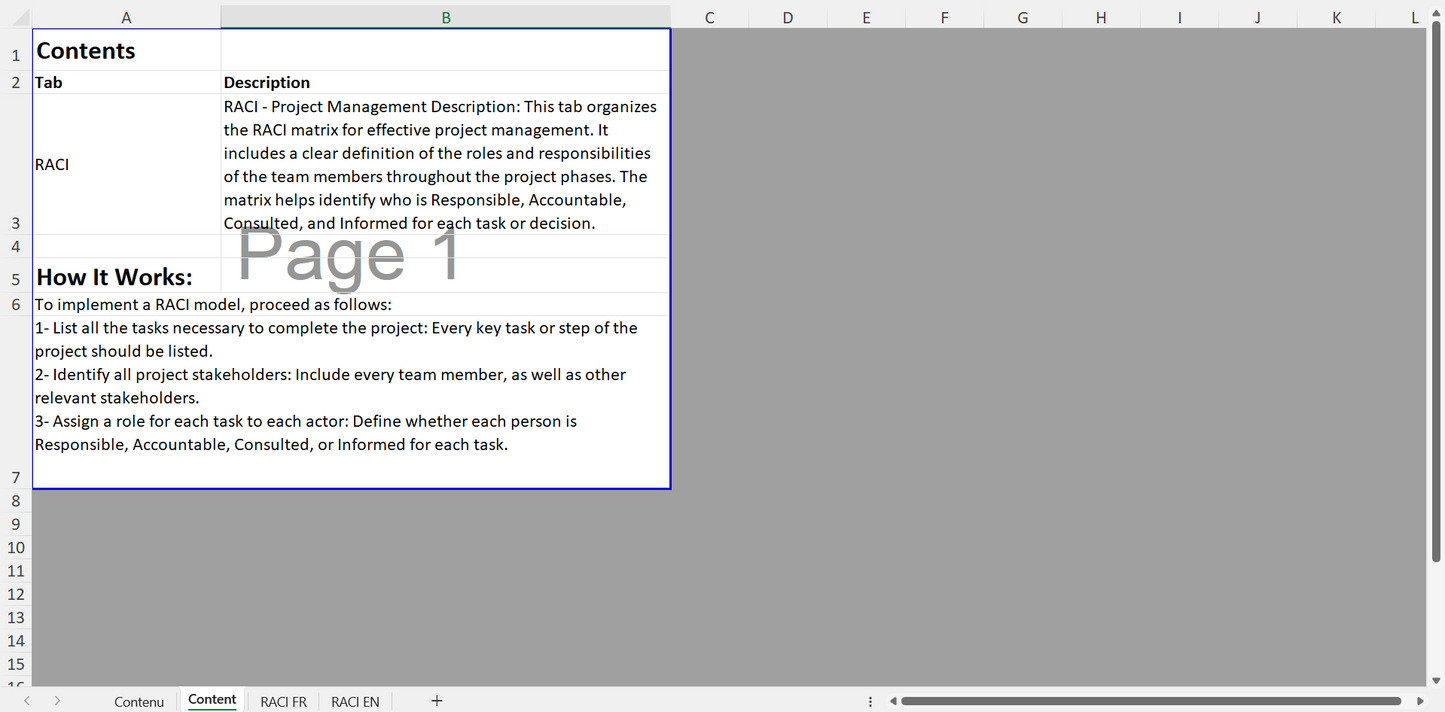
Check out our in-depth guide to the RACI matrix, an essential tool for any project manager looking to optimize communication and clarity of responsibilities within their teams. The RACI matrix, which clarifies who is Responsible, Accountable, Consulted, and Informed for each task, is ideal for projects that require precise coordination between multiple parties. This guide includes a practical example of a RACI matrix formatted for Excel, allowing for immediate and effective implementation. Learn how to set up and use your RACI matrix to improve your project management and strengthen collaboration between your team members.
This template is also compatible with Google Sheets and can be customized according to your needs. A direct access link will be sent to you after ordering.
Key Features
- Project management
- Role Assignment
Compatibility
- Microsoft Excel
- Google Sheets
Share
- Access your product in 30 seconds: steps 👇
- Title
- Title


FAQs
How can I customize this document template to meet the specific needs of my business?
Our document templates are designed to be easily customizable to meet the specific needs of each business. You can adjust the fields, formats, and calculations according to your requirements. If you need advanced customization, our support team is available to assist you in modifying and optimizing the template to perfectly fit your work environment.
Subscription offers
Subscription - Access to Excel, Power BI and Ms project tutorials and models
Corporate Pack
- No renewal constraints
- Full access to all tutorials:
- MS Project: Planning, Resources
- Power BI: Data Preparation, Dashboards
- Power Automate: Workflow Automation
- Full access to all models:
- Project management, Operational efficiency, Lean,...
- Premium Dashboards Included
- Unlimited downloads
- Personal space included
- 30 minute support included
Monthly Subscription
- Full access to all tutorials:
- MS Project: Planning, Resources
- Power BI: Data Preparation, Dashboards
- Power Automate: Workflow Automation
- Full access to all models:
- Project management, Operational efficiency, Lean,...
- Premium Dashboards Included
- Unlimited downloads
- Personal space included
- 30 minute support included
Annual Subscription
- All the advantages of the monthly
- Save 36% compared to monthly
- Priority consultation with an expert
- Updates and new models every week
Recommendations
-
J8/ Model — Calculation and monitoring of OEE Excel 2025 ...
4.94 / 5.0
(32) 32 total reviews
Regular price From €159,00Regular priceUnit price / per€279,00Sale price From €159,00Sale -
J9/ Budget and Deliverables Tracking Template for Business
3.67 / 5.0
(6) 6 total reviews
Regular price From €59,00Regular priceUnit price / per€249,00Sale price From €59,00Sale -
J28/ Power Bi Project Management Template to download
4.0 / 5.0
(8) 8 total reviews
Regular price From €0,00Regular priceUnit price / per -
J27/ MS Project Gantt Planning Template to download
Regular price From €69,00Regular priceUnit price / per -
J10/ Project Management Excel Model for project managers
4.82 / 5.0
(11) 11 total reviews
Regular price From €49,00Regular priceUnit price / per€219,00Sale price From €49,00Sale -
J30/ Power BI Model - Risk Analysis (Amdec)
Regular price From €0,00Regular priceUnit price / per -
J7/ Model — Example FMEA Excel Process - Dashboard - RPN ...
4.44 / 5.0
(9) 9 total reviews
Regular price From €59,00Regular priceUnit price / per -
C1/ ebook: White Paper - From vision to action, the futur...
5.0 / 5.0
(4) 4 total reviews
Regular price €39,00Regular priceUnit price / per -
A2/ Advanced OEE Excel Template - Powerful Manufacturing ...
4.87 / 5.0
(23) 23 total reviews
Regular price From €99,00Regular priceUnit price / per€99,00Sale price From €99,00 -
A1/ Template - Budget and project deliverables tracking -...
5.0 / 5.0
(3) 3 total reviews
Regular price From €29,00Regular priceUnit price / per€59,00Sale price From €29,00Sale -
A9/ Model - Project Risk Analysis - Google Sheet/Excel
2.0 / 5.0
(1) 1 total reviews
Regular price €39,00Regular priceUnit price / per€149,00Sale price €39,00Sale -
A3/ Model - Process FMEA - Google Sheet/Excel - Pro
4.0 / 5.0
(1) 1 total reviews
Regular price From €29,00Regular priceUnit price / per€59,00Sale price From €29,00Sale -
A5/ Model - Dasboard KPI Planning MS Project - Excel - Go...
Regular price From €49,00Regular priceUnit price / per -
A5/ Excel FMEA Template - Google Sheet/Excel - Basic
3.67 / 5.0
(3) 3 total reviews
Regular price €0,00Regular priceUnit price / per -
C2/ Model — OEE Dashboard - Production Tracking - Excel T...
4.0 / 5.0
(3) 3 total reviews
Regular price From €49,00Regular priceUnit price / per€99,00Sale price From €49,00Sale -
A6/ Template — Machine risk analysis — Google Sheet/Excel
Regular price €499,00Regular priceUnit price / per -
A8/ Model — Maintenance instructions - Example User Manua...
Regular price From €39,00Regular priceUnit price / per -
A4/ Model — Suppliers assessment — Google Sheet/Excel
5.0 / 5.0
(1) 1 total reviews
Regular price From €9,00Regular priceUnit price / per€29,00Sale price From €9,00Sale -
J6/ Model — Free Excel Production Monitoring File: Exampl...
3.0 / 5.0
(2) 2 total reviews
Regular price €0,00Regular priceUnit price / per -
J11/ PDF — TRS - Definition, calculation, benefits and im...
Regular price €0,00Regular priceUnit price / per -
J12/ PDF — Industry 5.0: Definition, technology, advantag...
Regular price €0,00Regular priceUnit price / per -
J13/ Maintenance Management Excel Model (CMMS)
5.0 / 5.0
(1) 1 total reviews
Regular price From €99,00Regular priceUnit price / per -
J29/ Power BI Model - TRS (Overall Earnings Ratio) Monito...
5.0 / 5.0
(1) 1 total reviews
Regular price From €0,00Regular priceUnit price / per -
J14/ 5S Excel Model: Checklist, Audit and Control for Ind...
Regular price €0,00Regular priceUnit price / per -
J15/ Advanced DMAIC Model for your Lean Six Sigma Project...
Regular price €0,00Regular priceUnit price / per
Any questions?

Contact form
blog posts
View all-

How to reduce the administrative costs of a com...
Introduction to Business Cost Reduction Reducing business costs is essential to maximizing profitability. Accounting, logistics, human resources: the tasks involved are essential, but also costly and time-consuming. However, it is...
How to reduce the administrative costs of a com...
Introduction to Business Cost Reduction Reducing business costs is essential to maximizing profitability. Accounting, logistics, human resources: the tasks involved are essential, but also costly and time-consuming. However, it is...
-

Improve your project management with the Kanban...
Introduction Businesses are facing unprecedented challenges when it comes to project management. Client expectations are rising, deadlines are shrinking, and project complexity is constantly increasing. Faced with these challenges, traditional...
Improve your project management with the Kanban...
Introduction Businesses are facing unprecedented challenges when it comes to project management. Client expectations are rising, deadlines are shrinking, and project complexity is constantly increasing. Faced with these challenges, traditional...
-

How to boost innovation?
Introduction Innovation is no longer a simple competitive advantage: in a context marked by the constant evolution of technologies and customer expectations, also with the acceleration towards industry 4.0 ,...
1 commentHow to boost innovation?
Introduction Innovation is no longer a simple competitive advantage: in a context marked by the constant evolution of technologies and customer expectations, also with the acceleration towards industry 4.0 ,...
1 comment


